Rendering static images from Grafana
700 words, 4 minutes
When it comes to rendering graphical representation of all the metrics I gather, I generally use RRDtool . Yes, I’m that old ;-) But I also have a Grafana instance from which I render stuff that can’t be done using RRDgraph. But, so far, I couldn’t generate a static PNG file from a panel to insert in a static web page.
But this was until I found the Grafana Image Rendered plug-in.
Introduction
To be honest, after reading the plug-in page, I was quite disappointed. That plug-in only supports Linux, Windows and Mac OS X; and I run Grafana in an OmniOS pkgsrc-branded zone. Once upon a time, I also ran it in an OpenBSD VM.
Also, the documentation is quite disturbing. It basically says that running the plug-in requires 16GB of RAM on the Grafana side, that it is not compatible with Docker but it can be run as an external remote service using Docker…
After a couple of WTF and a few @#%$*!, I finally found a configuration that allowed me to keep Grafana running on OmniOS and simply deploy a Docker container that takes care of the rendering.
( .... )             ( OmniOS zone )       (    Docker container    )
[ curl ]               [ Grafana ]         [ Grafana Image Renderer ]
   ⁞-- rendering request -->⁞                          ⁞
   ⁞                        ⁞--- rendering request --->⁞
   ⁞                        ⁞<-- PNG rendered image ---⁞
   ⁞<---- PNG image --------⁞                          ⁞
Grafana Image Rendering container
The official documentation explains how to set up image rendering .
I already have an Alpine Linux bhyve virtual machine, running Docker containers, on the OmniOS host that runs the Grafana zone. So I created the relevant Docker Compose file and started the container.
# mkdir grafana-image-renderer
# cd grafana-image-renderer
# cat > docker-compose.yaml
services:
  renderer:
    image: grafana/grafana-image-renderer:latest
    restart: unless-stopped
    ports:
      - "38081:8081"
    volumes:
      - ./config.json:/usr/src/app/config.json
# wget https://raw.githubusercontent.com/grafana/grafana-image-renderer/refs/heads/master/devenv/docker/custom-config/config.json

# docker compose up -d
The Grafana zone and the Docker container are both exposed inside an Ethernet stub. So I don’t really matter about authentication and transport encryption. In real life, you should probably care a bit more about those.
Grafana configuration
The version that is shipped with my pkgsrc tree is Grafana 11.0.0. There is a dedicated configuration section that can be filled-in to use the external rendered.
# vi /opt/local/etc/grafana.conf
(...)
[rendering]
server_url = http://docker_host:38081/render
callback_url = http://grafana_host:3000
# svcadm disable grafana
# svcadm enable grafana
Both hosts can be specified using IP addresses only. Once again, in real life, it would probably make sense to use TLS certificates.
Everything is now reading for static rendering.
On-demand image rendering
From a Grafana dashboard, click the ⋮ button of the panel you want to
render. Then, select “Share”.
At the bottom of the dialog box, click the “Direct link rendered image”.
A few moments later… the image appears in the Web browser.
I wrote a script that regularly queries Grafana for an updated image. The
PNG files are then saved in a dedicated storage space. Some Web pages
use the <img> tag to display the images via a Web site.
From the Grafana Web UI, browse to Administration / Users and access /
Service accounts.
Click “Add service account” and fill-in the display name and role; I
used “Viewer”.
Click “Add service account token”, fill-in the form and click “Generate
token”.
Copy the token value and keep it secret.
Copy the image URL that is generated via “Direct link rendered image” (cf previous section).
From the console, or a script, use cURL to request the image rendering, using the “Direct link rendered image” URL and the service account token.
# curl -H Authorization: Bearer _service_account_token_ \
-s -o /var/www/website/img/panel25.png                  \
https://grafana.example.com/render/d-solo/_uid_/_dashboard_name_?from=1743672342000&to=1744277142000&panelId=25&width=800&height=320&scale=1&tz=Europe%2FParis
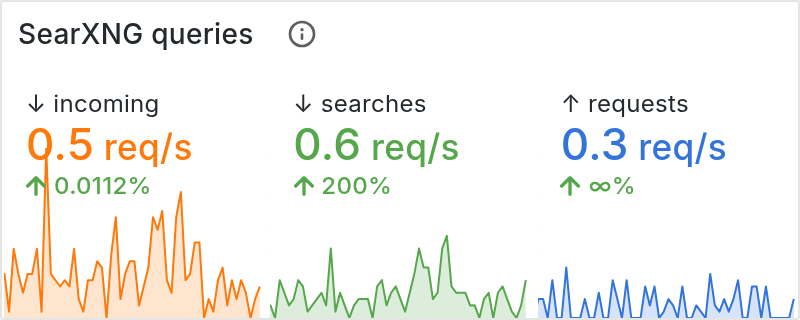
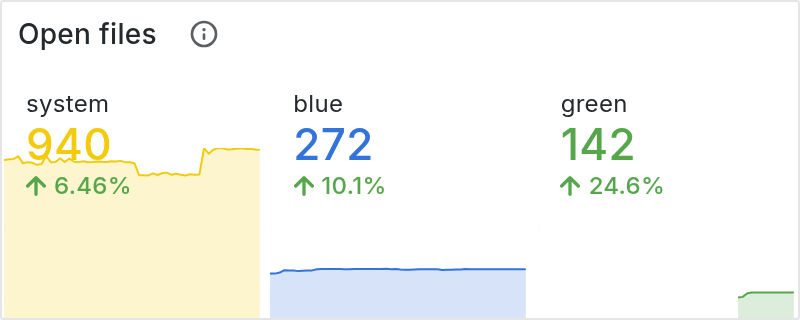
If you are lucky or smart enough, you should now be granted with images such as those:
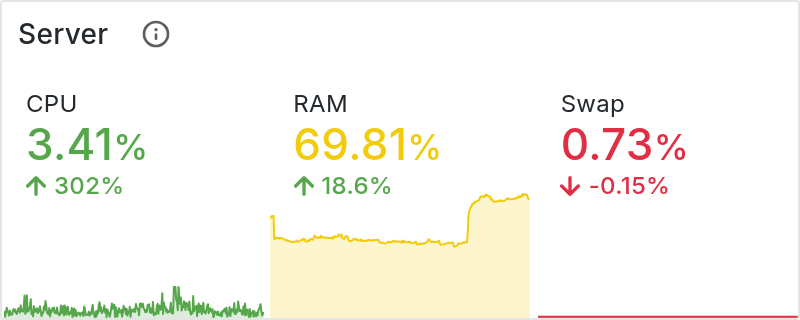
The rendering container runs on a virtual machine that has 2 vCPU and 2GB of RAM provisionned. When the rendering happens, all CPU cores goes to 100%. The rendering process takes about 10 seconds for each image.
Adjust the container configuration accordingly to your workflow. I will probably not configure 16GB of RAM and keep my configuration as-is.
That’s All Folks! And thanks again RRDtool , you served me well all those days!