Custom Prometheus dashboards using Console templates
1557 words, 8 minutes
Sometimes you just need a quick (and not so dirty) way to keep an eye on your server metrics. A nice thing with Prometheus is that it can be both a storage and a visualization solution for your metrics.
Here follows a quick example of what can be done using Prometheus Console Templates .
off-topic side notes
Yoo may skip this part and jump to Custom console templates if that’s what you came for.
I’m not using node_exporter
In the Prometheus world, the classic way to get metrics from your
servers and services is to use exporters and
integrations
. The
problem with those is that they often are Linux-centric. The
node_exporter
, in
particular, don’t provide network interface metrics on OmniOS (and any
Illumos derived-OS?).
I don’t have the knowledge to Shut up and hack!. Therefore, I’m just not using it.
Exposing metrics with collectd
Prometheus works in pull mode. A scraper runs somewhere, connects to various data source (exporters), get the data and store them in the Prometheus database.
I use collectd to gather metrics and expose a Prometheus-compatible network port that can be scraped. This is achieved using the Plugin Write Prometheus . It has the drawback that, if your OS is IPv6-ready, it will only listen on an IPv6 address. I couldn’t find a way to use an IPv4 address. That say, thanks to this bug (feature?), I had to (finally) learn IPv6.
An alternative that solves this IPv6 issue is
collectd_exporter
.
But I’ m not using it either because
- it is not available on OpenBSD (AFAIK)
- it exports ID rather than names for certain metrics .
I could probably Shut up and hack! to solve -1- and build a port. But right now, I’m too lame. And because -2-, I’m not sure it’s worth the effort.
Install collectd on OpenBSD
On OpenBSD, exposing metrics using collectd is quite straightforward.
# pkg_add collectd-prometheus
(...)
collectd-prometheus-5.12.0p0:collectd-5.12.0p1: ok
collectd-prometheus-5.12.0p0: ok

# rcctl enable collectd
# rcctl set collectd user "_collectd"

# chown -R _collectd /var/collectd
# vi /etc/collectd.conf
(...)
<Plugin write_prometheus>
  Port "9103"
</Plugin>

# rcctl start collectd
Install collectd on OmniOS
On OmniOS, the simplest way to use collectd is via pkgsrc .
# pkgin update

# pkgin in collectd-write_prometheus
(...)
[22/23] installing collectd-5.12.0nb3...
collectd-5.12.0nb3: Creating group ``collectd''
collectd-5.12.0nb3: Creating user ``collectd''
passwd: password information changed for collectd
collectd-5.12.0nb3: copying /opt/local/share/examples/collectd/collectd.conf to /opt/local/etc/collectd.conf
===========================================================================
This package has SMF support.  You may use svcadm(1M) to 'enable', 'disable'
or 'restart' services.  To enable the instance(s) for this package, run:

        /usr/sbin/svcadm enable -r svc:/pkgsrc/collectd:default

Use svcs(1) to check on service status.  See smf(5) for more information.
===========================================================================
[23/23] installing collectd-write_prometheus-5.12.0nb12...
pkg_install warnings: 0, errors: 0
reading local summary...
processing local summary...

# vi /opt/local/etc/collectd.conf
(...)
<Plugin write_prometheus>
  Host "omnios.home.arpa"
  Port "9103"
</Plugin>

# /usr/sbin/svcadm enable -r svc:/pkgsrc/collectd:default
The only reason to use the Host directive is because my OmniOS has
multiple network interfaces and I don’t want a Prometheus listener on
the public IP.
Install collectd on Linux
On a Debian system, installation goes like this:
# apt install collectd
# vi /etc/collectd/collectd.conf
(...)
<Plugin write_prometheus>
  Port "9103"
</Plugin>

# systemctl restart collectd
On an Alpine system, installation goes like this:
# apk add collectd collectd-write_prometheus

# vi /etc/collectd/collectd.conf
(...)
<Plugin write_prometheus>
  Host "fd00::110"
  Port "9103"
</Plugin>
Test the Prometheus listener
Using curl is any easy way to be sure the listener works.
# curl -s http://localhost:9103/metrics | head
# HELP collectd_cpu_count write_prometheus plugin: 'cpu' Type: 'count', Dstype: 'gauge', Dsname: 'value'
# TYPE collectd_cpu_count gauge
collectd_cpu_count{instance="prometheus"} 1 1706749479161
# HELP collectd_cpu_percent write_prometheus plugin: 'cpu' Type: 'percent', Dstype: 'gauge', Dsname: 'value'
# TYPE collectd_cpu_percent gauge
collectd_cpu_percent{cpu="0",type="idle",instance="prometheus"} 98.997995991984 1706749479162
collectd_cpu_percent{cpu="0",type="interrupt",instance="prometheus"} 0 1706749479162
collectd_cpu_percent{cpu="0",type="nice",instance="prometheus"} 0 1706749479162
collectd_cpu_percent{cpu="0",type="system",instance="prometheus"} 0.801603206412826 1706749479162
collectd_cpu_percent{cpu="0",type="user",instance="prometheus"} 0.200400801603206 1706749479162
Prometheus server
My Prometheus server is an OpenBSD virtual machine.
Because I can.
Because it works.
It runs with 1 vCPU and 1GB of RAM. And that’s plenty enough for my 10th of servers.
# pkg_add prometheus
(...)
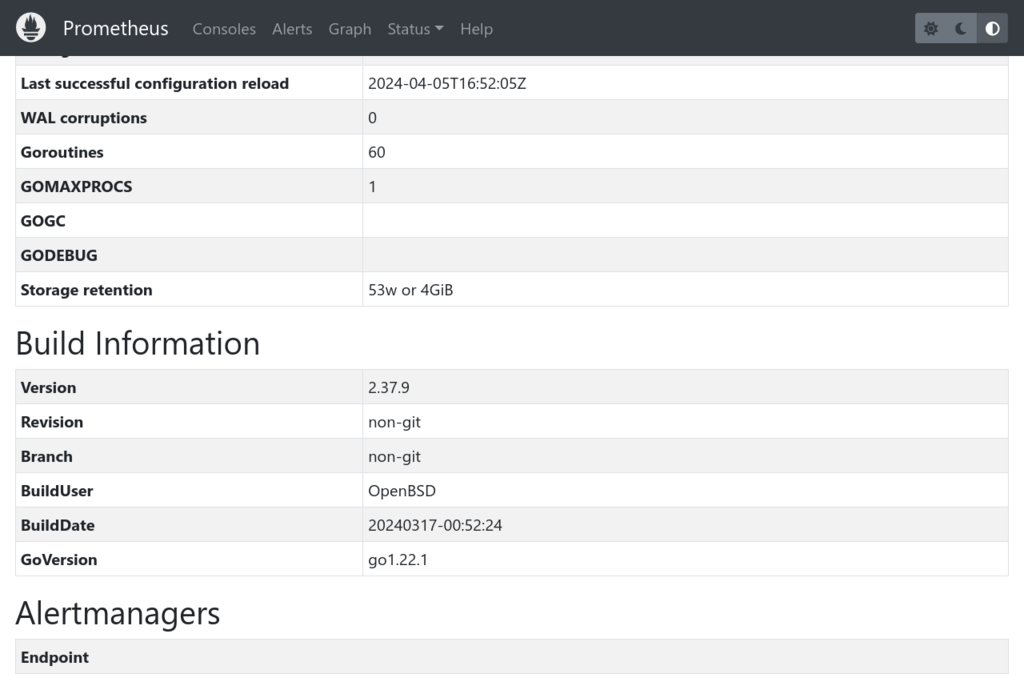
prometheus-2.37.9: ok
(...)

# rcctl enable prometheus
# rcctl set prometheus flags                                \
  --config.file=/etc/prometheus/prometheus.yml              \
  --storage.tsdb.path /home/prometheus                      \
  --storage.tsdb.retention.time=53w                         \
  --storage.tsdb.retention.size=4GB                         \
  --web.console.libraries=/etc/prometheus/console_libraries \
  --web.console.templates=/etc/prometheus/consoles

# cp -pr /var/prometheus /home/prometheus
# cp -pr /usr/local/share/examples/prometheus/console* /etc/prometheus/

# vi /etc/prometheus/prometheus.yml

# rcctl start prometheus
I’d rather use a dedicated directory in /home to store the data. This
is configured using the --storage.tsdb.path parameter.
I don’t want to database to get too big. So I limit it to either 4GB in size or drop data after a year.
The console parts are only needed if you want to use prometheus
templates. Which we will further down in this post.
To check that Prometheus works properly, target your Web browser to the TCP port 9090 or use a command such as curl.
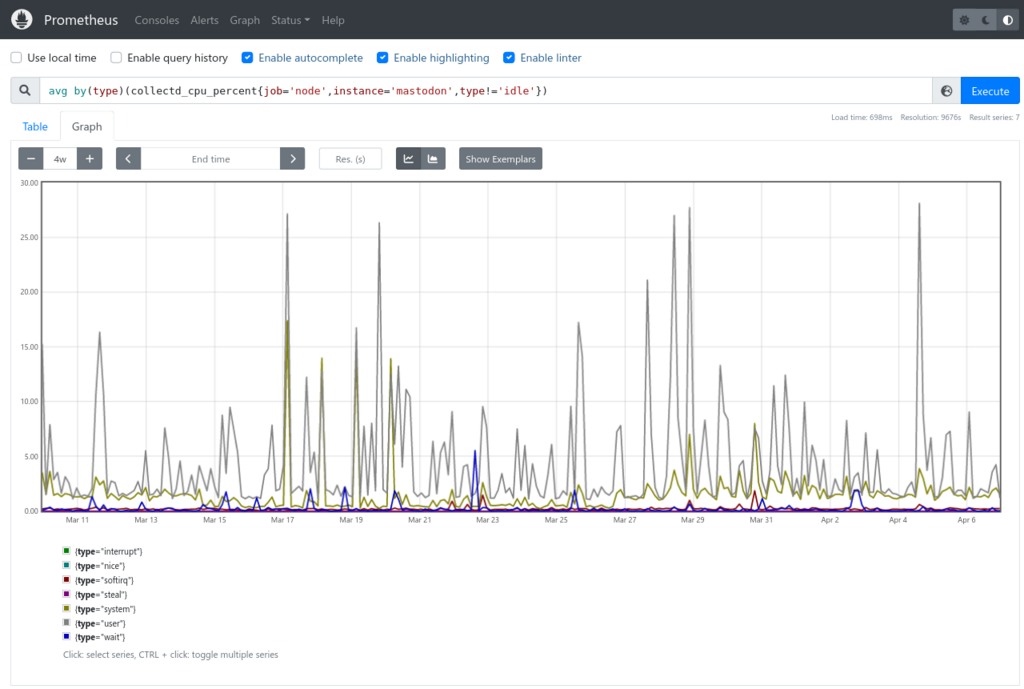
Graph and data exploration
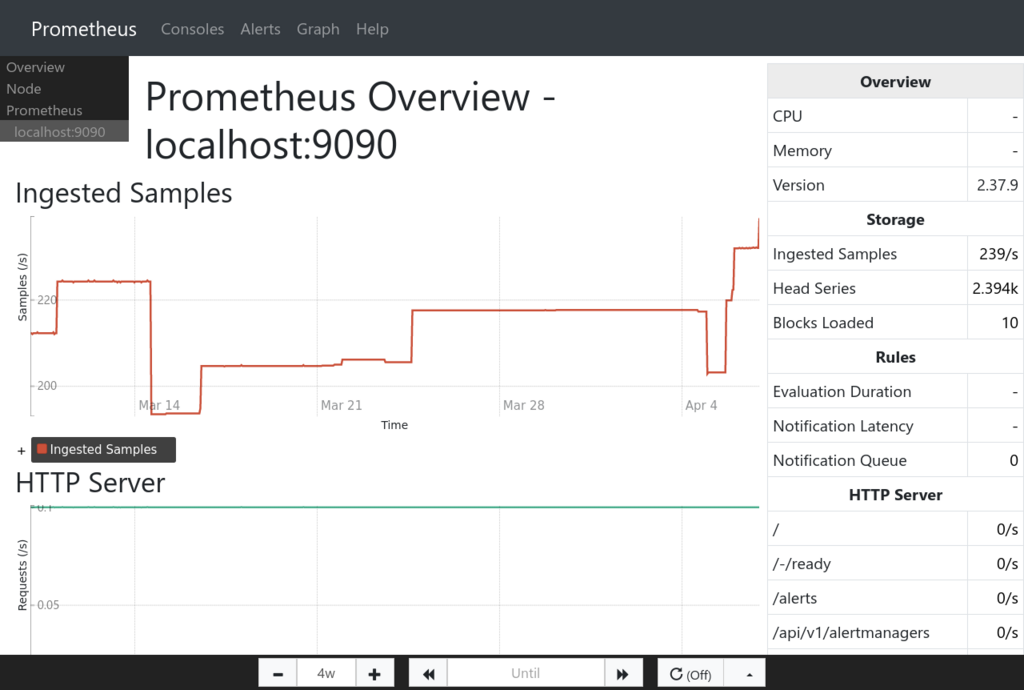
Browsing localhost:9090/graph, one can start exploring the collected data, test
building PromQL queries and get some graphics.
Now is a good time to have (another?) look at:
Console templates
Quoting the Console Templates webpage:
Console templates allow for creation of arbitrary consoles using the Go templating language. These are served from the Prometheus server. Console templates are the most powerful way to create templates that can be easily managed in source control. There is a learning curve though, so users new to this style of monitoring should try out Grafana first.
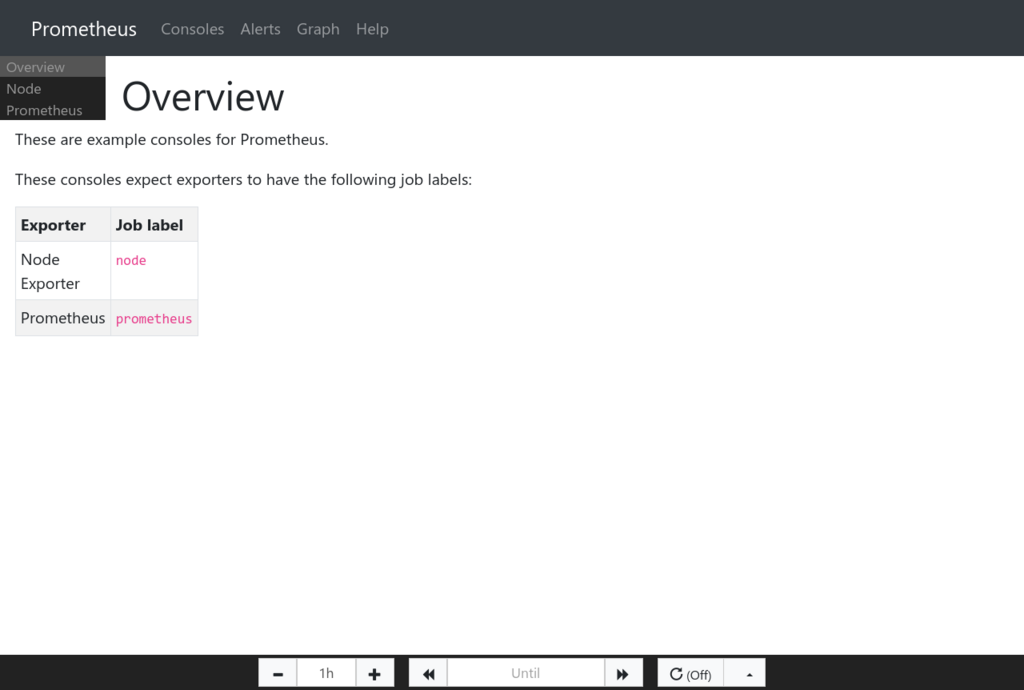
By default, you don’t get a link to the templates.
But pointing a Web browser to
localhost:9090/consoles/index.html.example reveils a bunch of default
templates.
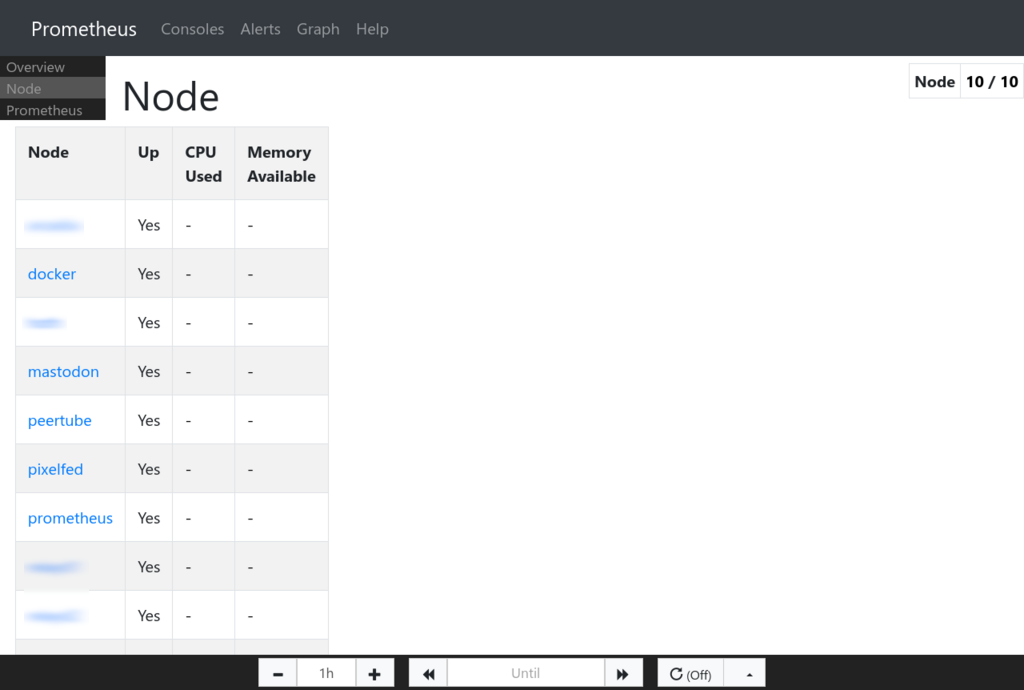
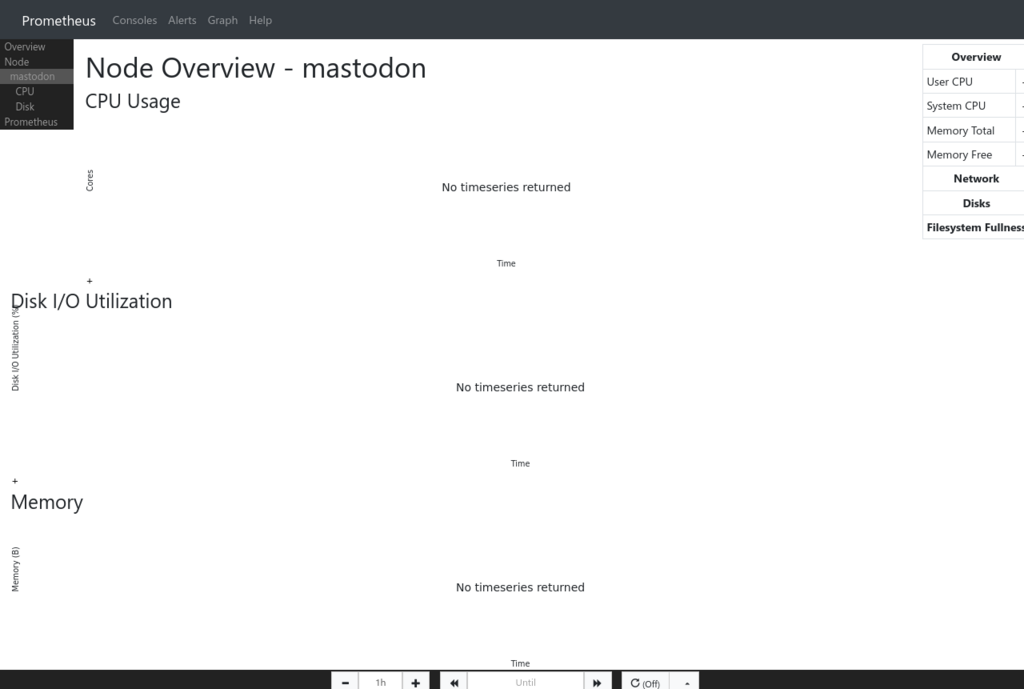
If you’re not playing smart and use something like node_exporter, the
node pages would be filled with data from it. But I’m using collectd and
the PromQL requests differ a bit.
AFAIK, there is no way to customize those standard output. But since you
add an index.html to /etc/prometheus/consoles/, you get access to a
fully customizeable section of Prometheus.
Custom console templates
The simplest way to start customising is to copy the original
index.html.example file to index.html. Then start studying the other
file and experiment with those.
The menu bar
I didn’t like the default menu bar so I modified it a bit.
--- /usr/local/share/examples/prometheus/console_libraries/menu.lib     Sun Mar 17 01:59:53 2024
+++ /etc/prometheus/console_libraries/menu.lib  Fri Apr  5 01:34:14 2024
@@ -19,6 +19,8 @@
     <div class="collapse navbar-collapse" id="bs-example-navbar-collapse-1">
       <ul class="nav navbar-nav">
+        <li class="nav-item"><a class="nav-link" href="{{ pathPrefix }}/consoles/index.html">Consoles</a></li>
         <li class="nav-item"><a class="nav-link" href="{{ pathPrefix }}/alerts">Alerts</a></li>
-        <li class="nav-item"><a class="nav-link" href="https://www.pagerduty.com/">PagerDuty</a></li>
+        <li class="nav-item"><a class="nav-link" href="{{ pathPrefix }}/graph">Graph</a></li>
+        <li class="nav-item"><a class="nav-link" href="https://prometheus.io/docs/prometheus/latest/getting_started/">Help</a></li>
       </ul>
     </div>
Content of header, footer etc can be changed by modifying
/etc/prometheus/console_libraries/prom.lib. I didn’t find a usecase
for it.
The landing page
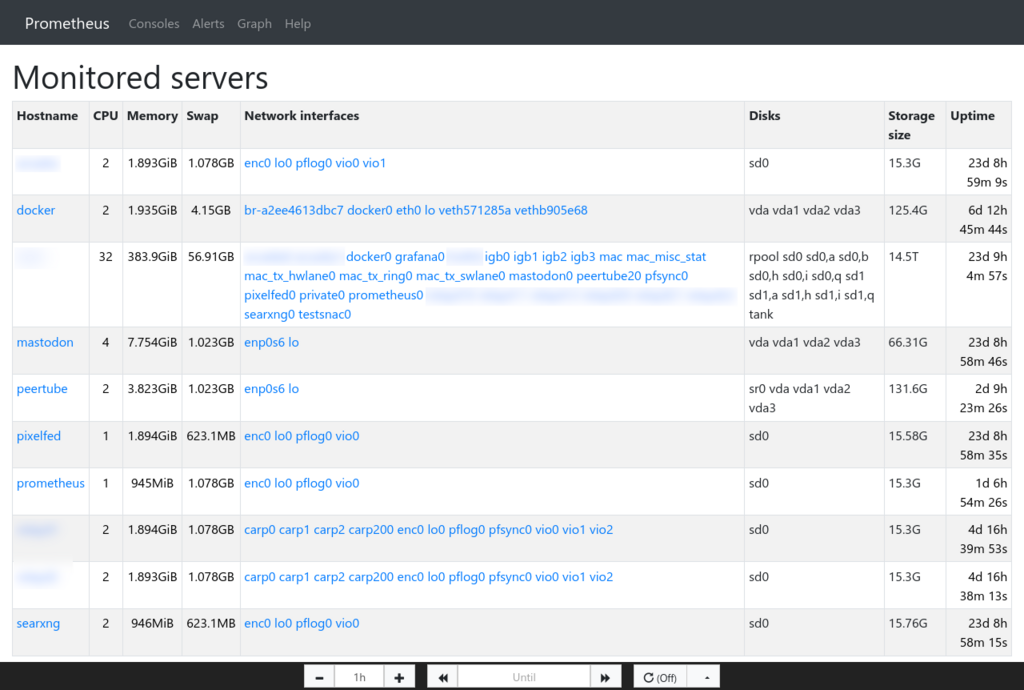
I wanted an index.html page that would list the servers (nodes) I
have, sum up their configuration and provide access to metrics graphs.
Links to the Prometheus template - the header, footer and menu that was modified - is achieved using Go templating language.
{{ template "myhead" .}}
{{template "prom_content_head" .}}
(...)
{{template "prom_content_tail" .}}
{{template "tail"}}
The array is rendered using classical HTML.
<h1>Monitored servers</h1>
<table class="table table-sm table-striped table-bordered" style="width: 100%">
<tr>
<th>Hostname</th>
<th>CPU</th>
<th>Memory</th>
<th>Swap</th>
<th>Network interfaces</th>
<th>Disks</th>
<th>Storage size</th>
<th>Uptime</th>
</tr>
(...)
The data are fetched using a mix of Go templating language and PromQL, depending on the use case.
{{ range query "up{job='node'}" | sortByLabel "instance" }}
(...)
{{ else }}
(...)
{{ end }}

{{ range printf "collectd_disk_disk_octets_read_total{job='node',instance='%s'}" .Labels.instance | query | sortByLabel "disk" }}
{{ .Labels.disk }}
{{end}}

{{ template "prom_query_drilldown" (args (printf "collectd_cpu_count{job='node',instance='%s'}" .Labels.instance)) }}
It took me quite a long time to understand how to put all those
together. Probably because I’m no Dev and have never studied Go. If
you’re in the same boat, you may have a look at the full index.html
file
. Copy it to
/etc/prometheus/consoles/index.html are start tweaking :)
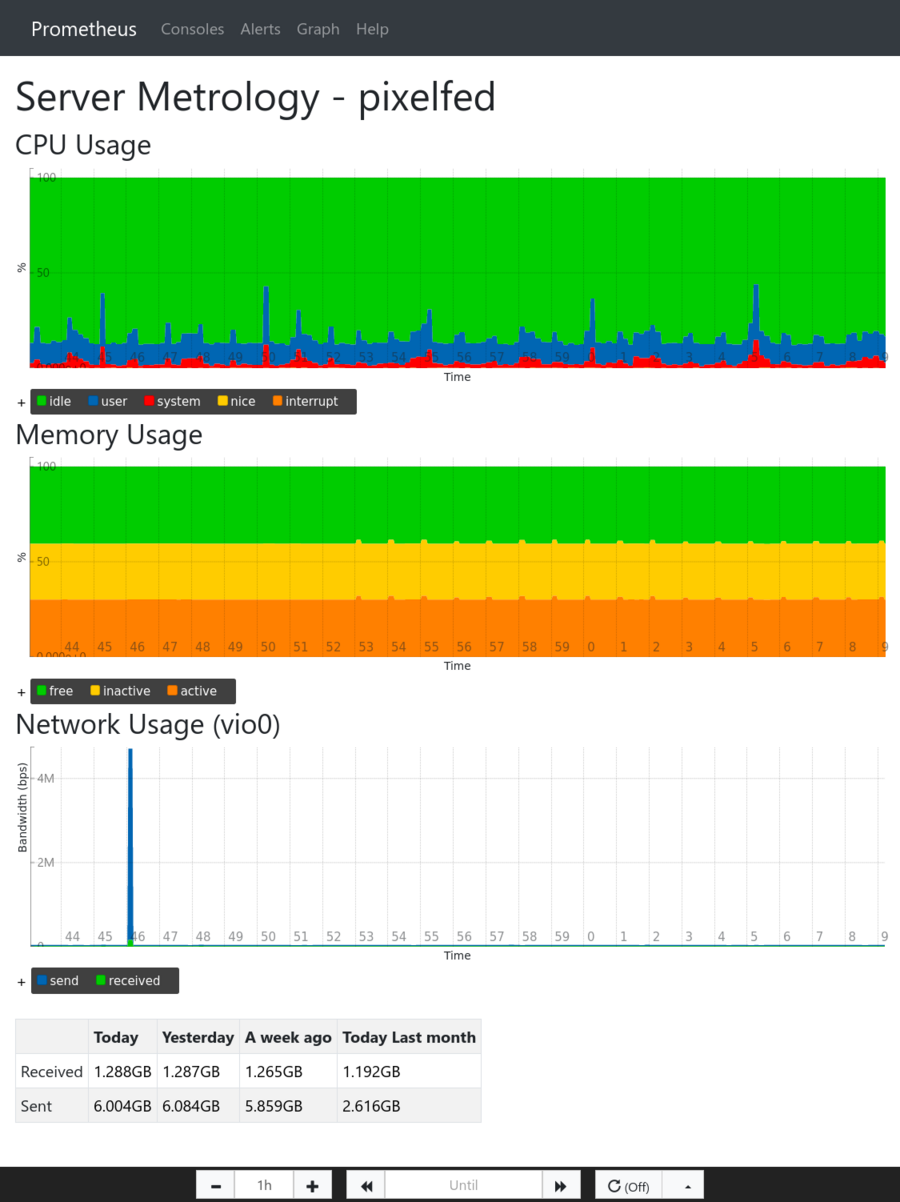
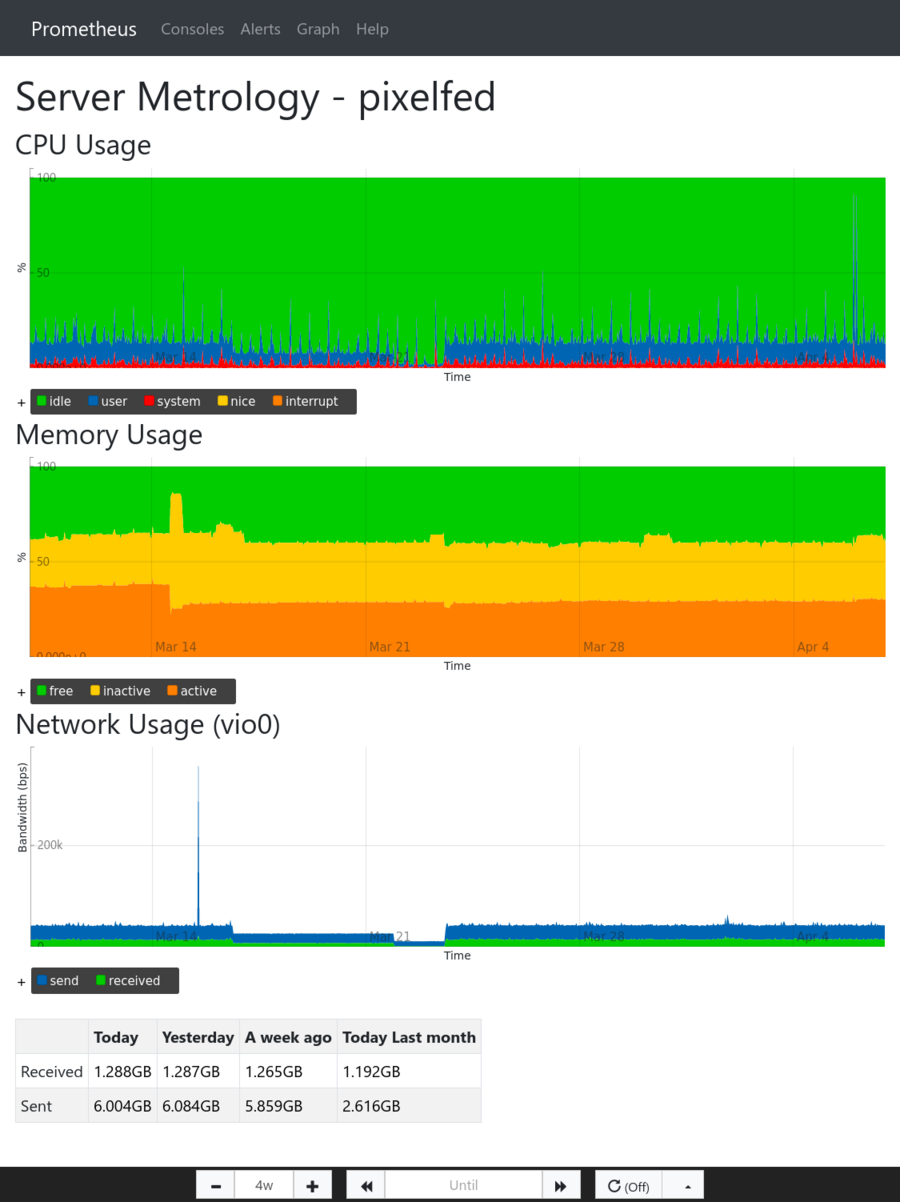
The other thing I wanted is some kind of vnStat page where I could look at what happens to the servers in, nearly, realtime.
As previously, the web page is a mix of HTML code and Go / PromQL. The
colorscheme has been modified to match the metrics and the order they
appear. It is more or less inspired by RRDtool and Munin way of
displaying graphs. Here’s the full vnStat inspired web
page
. It must be
copied to /etc/prometheus/consoles/vnstat.html.
Conclusion
My goal was partially achieved. Prometheus templates are a great light
way to visualize the scraped data ; whether it is from node_exporter
or from collectd. But there are still a few limits that bug me.
- The right array renders really badly. Maybe it’s my Firefox. But it uses really bad margin / padding / sizes.
- Numbers are pretty printed using Humanize/Humanize1024 function. But this lead to float number that are really annoying to look at.
- Graphs take the whole width. On a wide screen, I’d rather have 2 or 3 horizontally align. Maybe HTML divs and CSS could come to the rescue.
- Graphs can’t mix Lines and Area. I like to have the swap usage as a line on top of ram usage stacks.
- Colors are distributed to metrics in the order they appear. But CPU or
Memory metrics number vary between OSes: OmniOS doesn’t have
nicevalue, Linux have a bunch more CPU states, etc. This leads to colors not being consistent between servers. - AFAIK there are no histograms.
This was a great exercice but I think I will still really on Grafana for the rendering parts.
