Storing unbound(8) logs into InfluxDB
828 words, 4 minutes
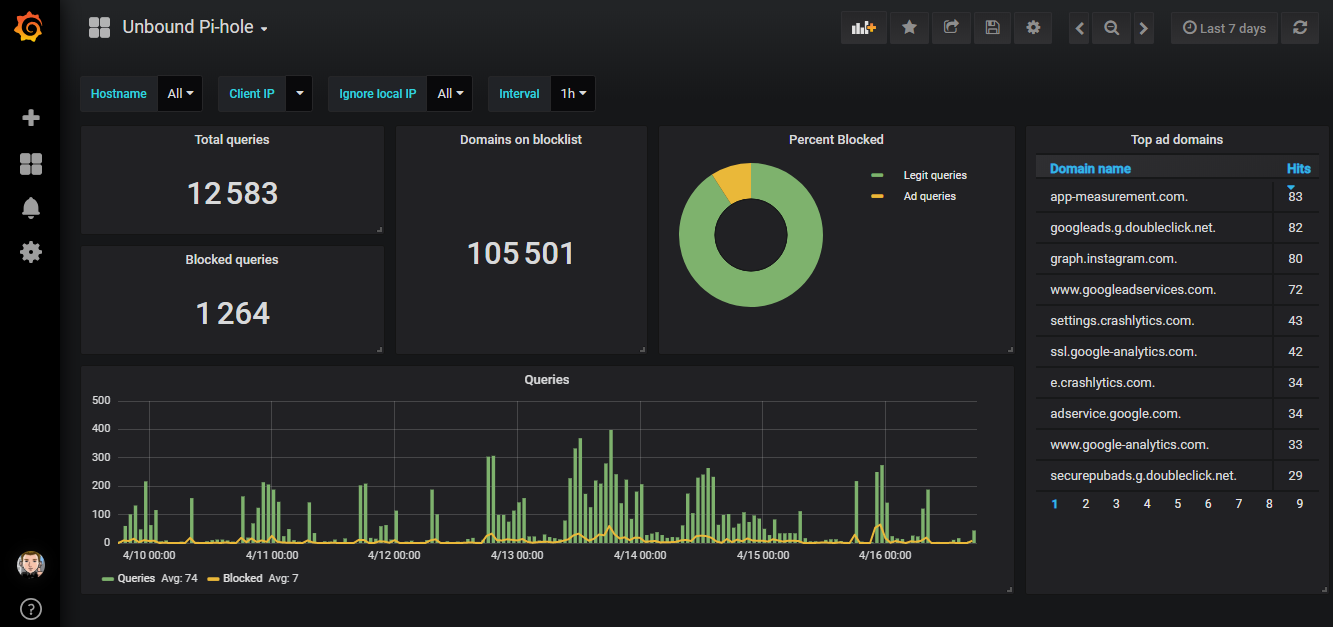
I’m using unbound(8) on OpenBSD to block Ads . In the logs, I can see which domains were queried and blocked ; but I like to have a more graphical overview of whats happening over weeks. So I stole a few ideas from the Pi-Hole Web Interface , routed the logs to InfluxDB via syslog-ng and rendered statistics using Grafana.
How it works
The unbound(8) daemon is configured to log via syslogd(8) which forwards relevant logs to a remote syslog-ng(8) instance. The syslog-ng(8) process identifies and parses unbound(8) logs into tags and fields and sends the data to influxd(1) using the InfluxDB HTTP API.
The following describes parsing both “standard” unbound(8) logs and “redirect” logs ; used in my “block Ad” configuration. In the case of a standard / simple unbound(8) configuration, there is no need for the “*_redirect” parts.
The InfluxDB database
I’m using a dedicated InfluxDB database to store all my parsed logs. The database has to be manually created. The measurements will be created by syslog-ng.
# influx -host $_influxdbserver
> CREATE DATABASE logs
A set of measurements are used to stored various aspects of the daemon logs. In the case of unbound(8), the following measurements will be created by the whole process:
> USE logs
> SHOW TAG KEYS FROM "unbound" ; SHOW FIELD KEYS FROM "unbound"
 name: unbound
 tagKey
 class
 clientip
 from_cache
 name
 return_code
 sysName
 type
 name: unbound
 fieldKey        fieldType
 --------        ---------
 response_size   integer
 time_to_resolve float
> SHOW TAG KEYS FROM "unbound_redirect" ; SHOW FIELD KEYS FROM "unbound_redirect"
 name: unbound_redirect
 tagKey
 class
 clientip
 name
 sysName
 type
 name: unbound_redirect
 fieldKey   fieldType
 --------   ---------
 void_field integer
The usage of “tags” is required by the “group by” queries that I will use in Grafana. Without the use of “group by”, the values could have been stored as text “fields”.
The syslog-ng configuration
Syslog-ng is configured to listen on port 60514 to receive logs from various other remote syslog instances. Nothing specific here. Use whatever port you like and enable the proper listeners. In my case, the unbound(1) rules are stored in a dedicated file :
# cat /etc/syslog-ng/unbound.conf
(...)
source s_net {
  udp(ip(192.168.0.2) port(60514));
  tcp(ip(192.168.0.2) port(60514));
};
(...)
@include "/etc/syslog-ng/unbound.conf"
Regarding the parsing process, I’m using the syslog-ng db_parser . Note that OpenBSD 6.4 provides a syslog-ng 3.12 package. The configuration may vary with newer syslog-ng versions:
# cat "/etc/syslog-ng/unbound.conf"
(...)
filter f_unbound_query {
  filter(f_unbound) and tags("query");
};
filter f_unbound_redirect {
  filter(f_unbound) and tags("redirect");
};
(...)
parser p_unbound {
  db_parser(file("/etc/syslog-ng/unbound.xml"));
};
(...)
destination d_influxdb_unbound_query {
  http(
    url("http://127.0.0.1:8086/write?db=logs&precision=ms")
    persist-name("influxdb_unbound_query")
    method("POST")
    user_agent("syslog-ng")
    body("unbound,sysName=${HOST},clientip=${CLIENTIP},name=${NAME},type=${TYPE},class=${CLASS},return_code=${RETURN_CODE},from_cache=${FROM_CACHE} time_to_resolve=${TIME_TO_RESOLVE},response_size=${RESPONSE_SIZE}i ${UNIXTIME}${MSEC}")
   );
};
destination d_influxdb_unbound_redirect {
  http(
    url("http://127.0.0.1:8086/write?db=logs&precision=ms")
    persist-name("influxdb_unbound_redirect")
    method("POST")
    user_agent("syslog-ng")
     body("unbound_redirect,sysName=${HOST},clientip=${CLIENTIP},name=${NAME},type=${TYPE},class=${CLASS} void_field=1i ${UNIXTIME}${MSEC}")
    );
};
(...)
log {
  source(s_net);
  filter(f_unbound);
  parser(p_unbound);
  filter(f_unbound_query);
  destination(d_influxdb_unbound_query);
};
log {
  source(s_net);
  filter(f_unbound);
  parser(p_unbound);
  filter(f_unbound_redirect);
  destination(d_influxdb_unbound_redirect);
};
The pattern database only identifies general queries and queries from the Ad-blocker list. Each matching pattern is then taggued. The tags are used to route the data to the proper InfluxDB measurement:
(...)
<!-- queries -->
<rule id="unbound-query" class='system' provider='syslog-ng'>
  <patterns>
    <pattern>@ESTRING:PID: @@ESTRING:SEVERITY: @@ESTRING:CLIENTIP: @@ESTRING:NAME: @@ESTRING:TYPE: @@ESTRING:CLASS: @@ESTRING:RETURN_CODE: @@FLOAT:TIME_TO_RESOLVE:@ @NUMBER:FROM_CACHE:@ @NUMBER:RESPONSE_SIZE:@</pattern>
  </patterns>
  <tags><tag>query</tag></tags>
</rule>
(...)
<!-- redirect queries (AD Blocklists) -->
<rule id="unbound-redirect" class='system' provider='syslog-ng'>
  <patterns>
    <pattern>@ESTRING:PID: @@ESTRING:SEVERITY: @@ESTRING:NAME: @redirect @IPvANY:CLIENTIP:@@@@NUMBER:PORT:@ @ESTRING:NAME: @@ESTRING:TYPE: @@STRING:CLASS:@</pattern>
  </patterns>
  <tags><tag>redirect</tag></tags>
</rule>
(...)
The complete current version of the conf file is available here and the XML is there .
The unbound and syslogd parameters
From the local syslogd(8) perspective, it is as simple as:
# cat /etc/syslog.conf
(...)
@udp4://192.168.0.2:60514
Everything will be send to the syslog-ng(8) instance. In the case where only unbound(8) logs should be forwarded, I expect the following syntax to be enough:
!unbound
*.* @udp4://192.168.0.2:60514
Regarding the unbound(8) configuration, I used the following specifics:
# cat /var/unbound/etc/unbound.conf
(...)
use-syslog: yes
log-queries: no
log-replies: yes
log-local-actions: yes
verbosity: 0
The “log-replies” provides more detailed information (like time to resolve and response code) including those provided by “log-queries”. The “log-local-actions” is used to provide information about the local zones (used in the block Ad configuration).
The Grafana dashboard
One could get the data straight from InfluxDB using query like:
> USE logs
> SELECT count("time_to_resolve") AS "Total Queries" \
  FROM "unbound" WHERE (time >= now() - 7d)
name: unbound
time                           Total Queries
----                           -------------
2019-04-10T14:04:17.965045965Z 319943
The complete JSON file for this dashboard can be downloaded from the Grafana.com dashboard section .
Note that the filter parts of the dashboard doesn’t work when using InfluxDB 1.6.1 or 1.6.6 on OpenBSD 6.4/amd64. I couldn’t guess why. This comes from the following error on the influxd side:
> SHOW TAG VALUES FROM unbound WITH KEY = clientip WHERE sysName =~ /srv1/
ERR: SHOW TAG VALUES FROM unbound WITH KEY = clientip WHERE sysName =~ /srv1/ \
[panic:runtime error: index out of range]
One can force the filtering using variables in the URL. It’s a bit dirty but at least, it works. This error does not happen when using InfluxDB on FreeBSD or Ubuntu Linux. If you can guess what I did wrong, just ping me! :)
