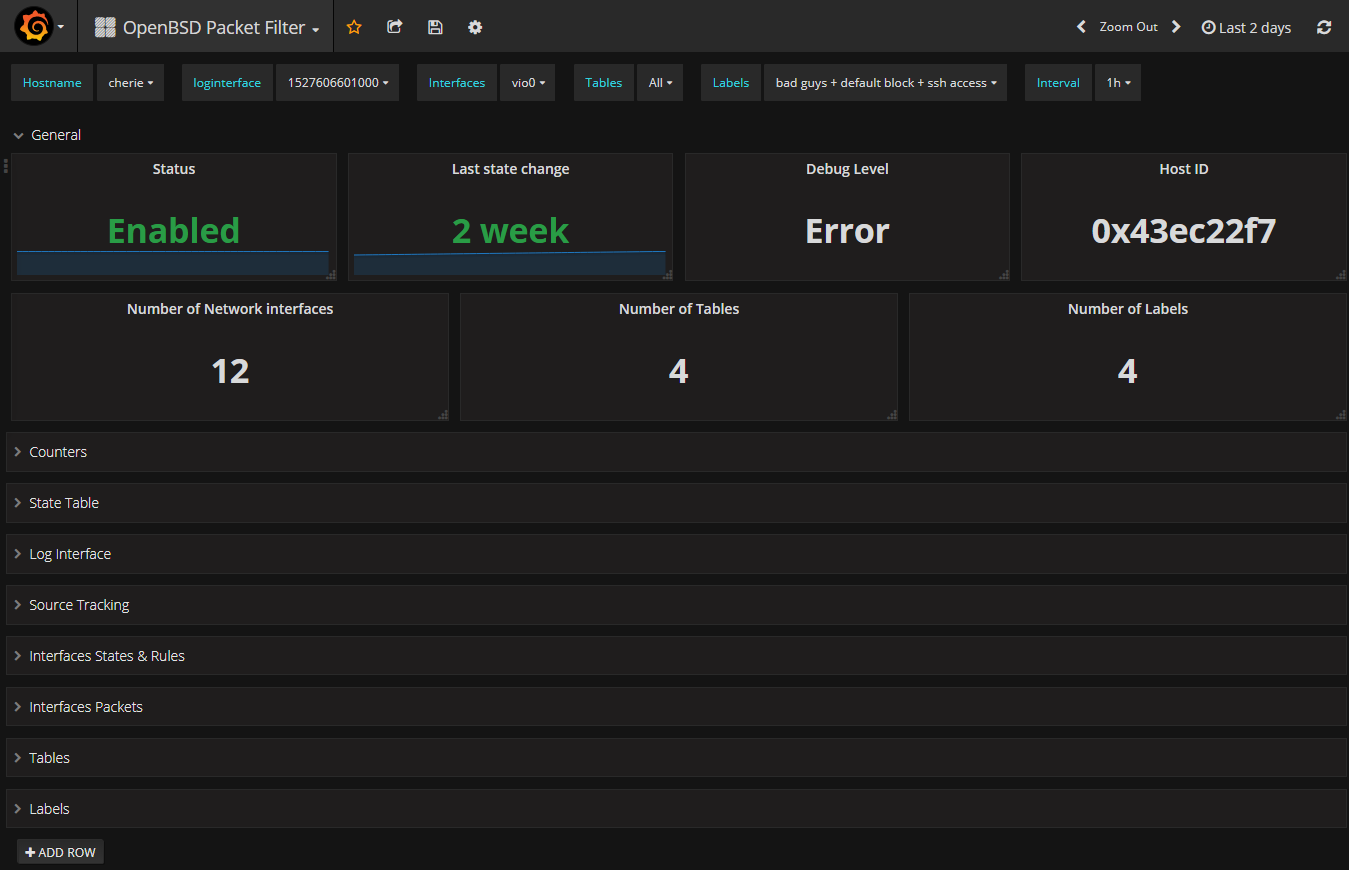
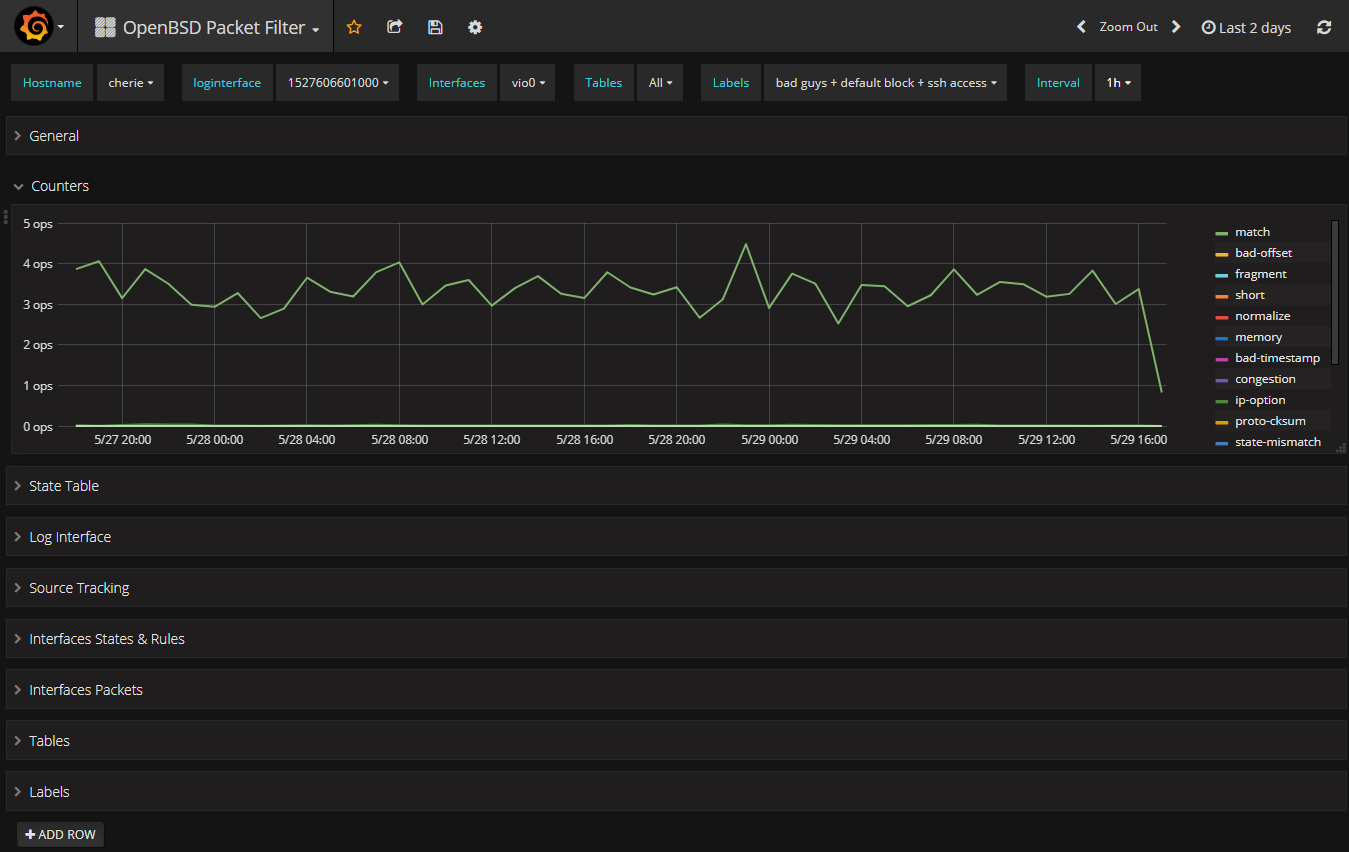
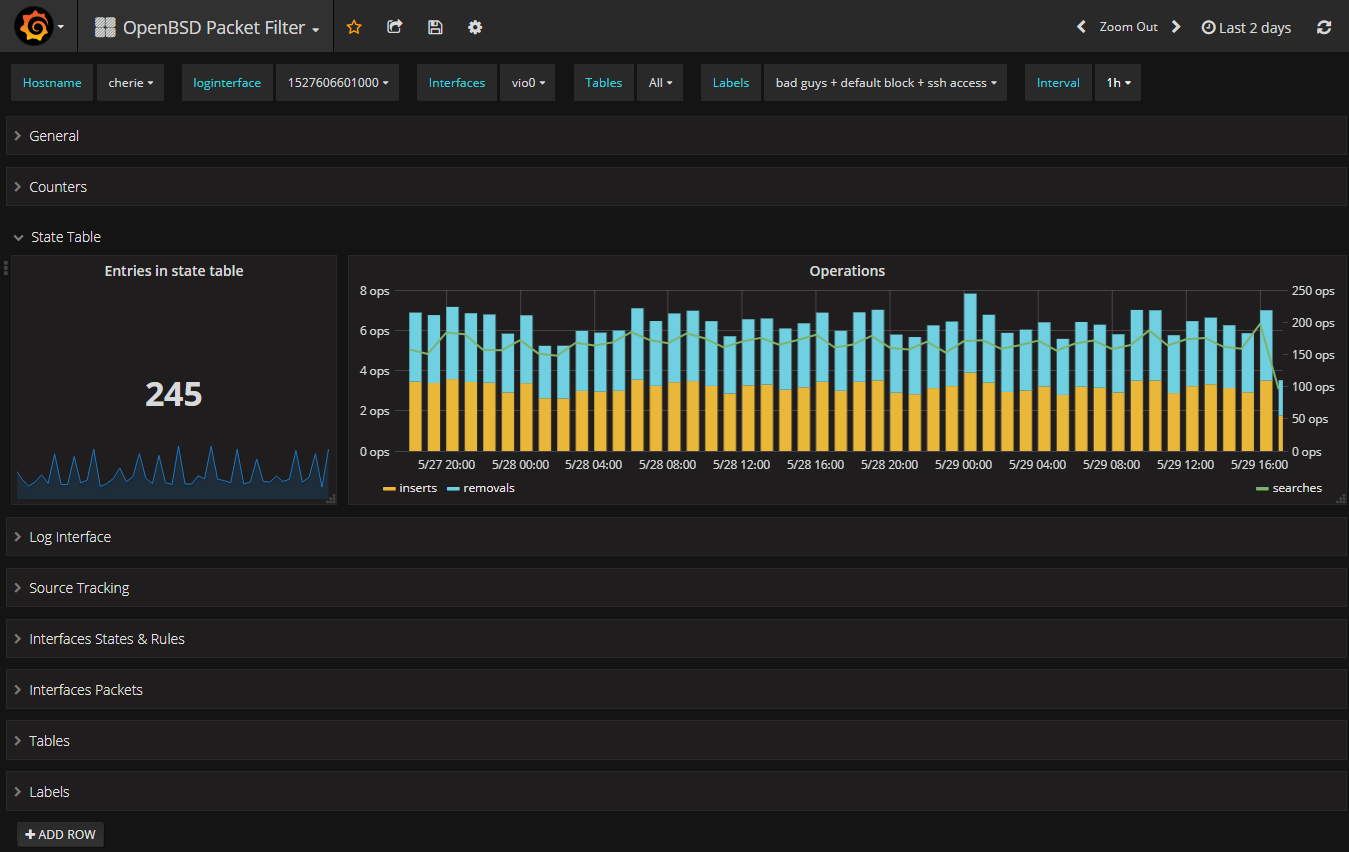
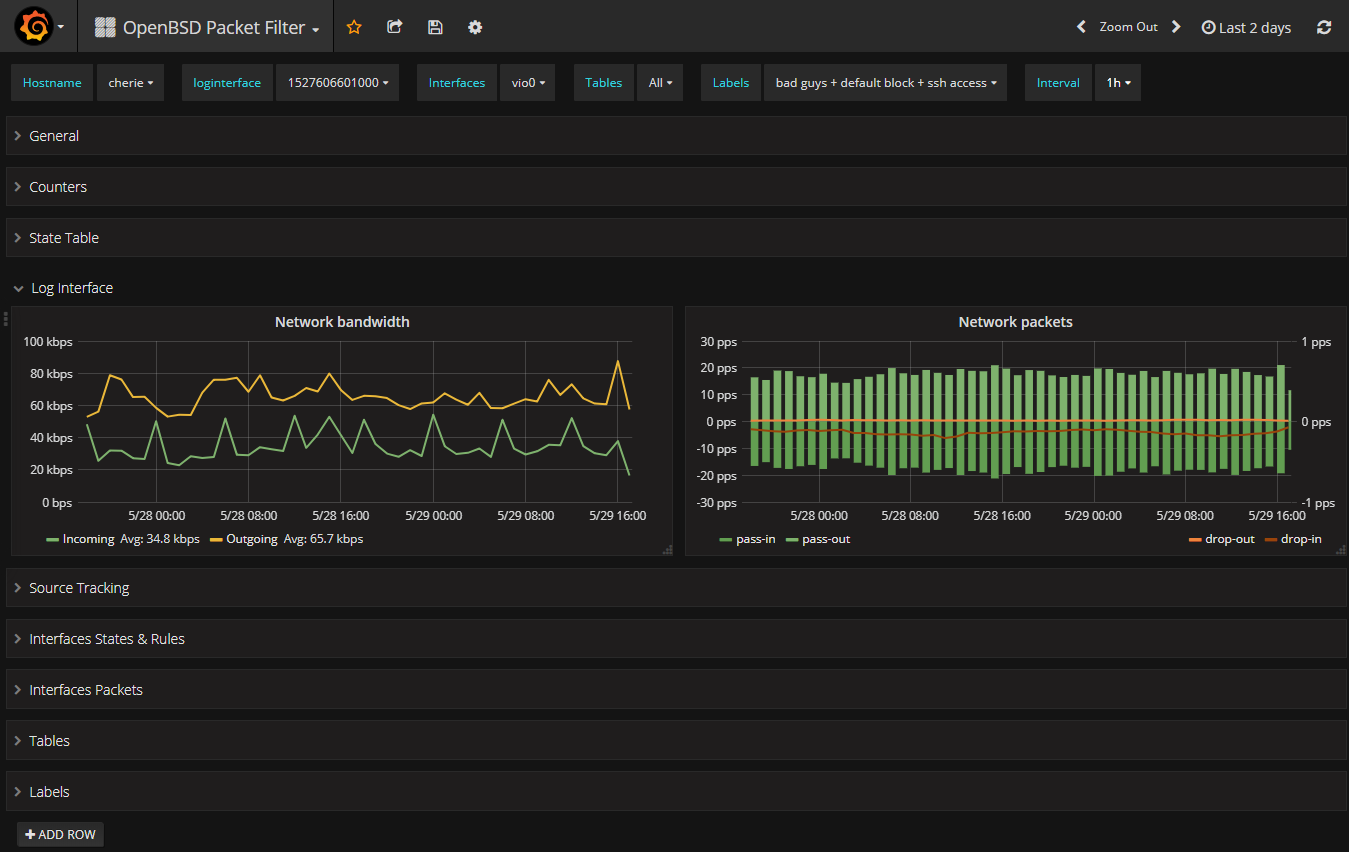
Monitoring pf(4) using snmpd(8), Telegraf and Grafana
514 words, 3 minutes
I regularly check my pf(4) activity using pfctl(8) and pflogd(8). I already monitored pf using collectd(1) and rrdtool. This time, I wanted to use my already configured InfluxDB/Grafana system. The thing is, Telegraf is not (yet) available in OpenBSD 6.3. So I used a Telegraf container to remotely poll OpenBSD using the native SNMP OPENBSD-PF-MIB.
Enable SNMP for PF
This is really straight forward:
# rcctl enable snmpd
# rcctl start snmpd
# snmpwalk -v 2c -c public localhost OPENBSD-PF-MIB:pfInfo
OPENBSD-PF-MIB::pfRunning.0 = INTEGER: true(1)
OPENBSD-PF-MIB::pfRuntime.0 = Timeticks: (112916400) 13 days, 1:39:24.00 1/100th of a Second
OPENBSD-PF-MIB::pfDebug.0 = INTEGER: err(3)
This was easy. If pf(4) is not enabled, you will see it.
Install MIBs on the polling system
If you don’t want to deal with OIDs, you’ll have to make the OpenBSD MIBs available from the polling system ; in my case, the Telegraf container. From the OpenBSD server, transfer the files in /usr/share/snmp/mibs/ to the poller host.
# scp /usr/share/snmp/mibs/*txt user@telegraf:~/.snmp/mibs/
Not sure why, but the container didn’t use my MIBs auto-magically. On the Telegraf host, I had to configure the snmp client :
# cat ~user/.snmp/snmp.conf
mibs +OPENBSD-BASE-MIB
mibs +OPENBSD-CARP-MIB
mibs +OPENBSD-MEM-MIB
mibs +OPENBSD-PF-MIB
mibs +OPENBSD-RELAYD-MIB
mibs +OPENBSD-SENSORS-MIB
From here, snmp client is able to resolve my OIDs.
Collect the statistics
The Telegraf container will poll the snmpd(8) every minutes and stored the statistics and information in an InfluxDB instance - running on OpenBSD 6.3 :)
The configuration section looks like this :
[[inputs.snmp]]
  agents = [ "10.0.0.1:161" ]
  timeout = "5s"
  retries = 3
  version = 2
  community = "public"

  # pf(4) statistics
  #
  name = "snmp_pf"

  [[inputs.snmp.field]]
    name = "sysName"
    oid = "RFC1213-MIB::sysName.0"
    is_tag = true
(...)
This defines the SNMP section using host IP and community. I’m using a specific measurement in InfluxDB to only store pf data. And I’m using the snmp sysName as a tag to refer to my hosts.
Then I configure the various sections I’m looking for.
# pfInfo
[[inputs.snmp.field]]
  name = "pfRunning"
  oid = "OPENBSD-PF-MIB::pfRunning.0"
[[inputs.snmp.field]]
  name = "pfRuntime"
  oid = "OPENBSD-PF-MIB::pfRuntime.0"
  conversion = "float"
[[inputs.snmp.field]]
  name = "pfDebug"
  oid = "OPENBSD-PF-MIB::pfDebug.0"
  conversion = "int"
[[inputs.snmp.field]]
  name = "pfHostid"
  oid = "OPENBSD-PF-MIB::pfHostid.0"
(...)
#pfStateTable
[[inputs.snmp.field]]
  name = "pfStateCount"
  oid = "OPENBSD-PF-MIB::pfStateCount.0"
[[inputs.snmp.field]]
  name = "pfStateSearches"
  oid = "OPENBSD-PF-MIB::pfStateSearches.0"
[[inputs.snmp.field]]
  name = "pfStateInserts"
  oid = "OPENBSD-PF-MIB::pfStateInserts.0"
[[inputs.snmp.field]]
  name = "pfStateRemovals"
  oid = "OPENBSD-PF-MIB::pfStateRemovals.0"
(...)
#pfInterfaces
[[inputs.snmp.table]]
  name = "snmp_pfInterfaces"
  oid = "OPENBSD-PF-MIB::pfIfTable"
  inherit_tags = [ "sysName" ]
  [[inputs.snmp.table.field]]
    oid = "OPENBSD-PF-MIB::pfIfDescr"
    is_tag = true
  [[inputs.snmp.table.field]]
    oid = "OPENBSD-PF-MIB::pfIfType"
    is_tag = true
(...)
Those are some relevant examples from various cases (format conversion, tables…) Just choose the ones you require reading the MIB file.
Access and render the statistics
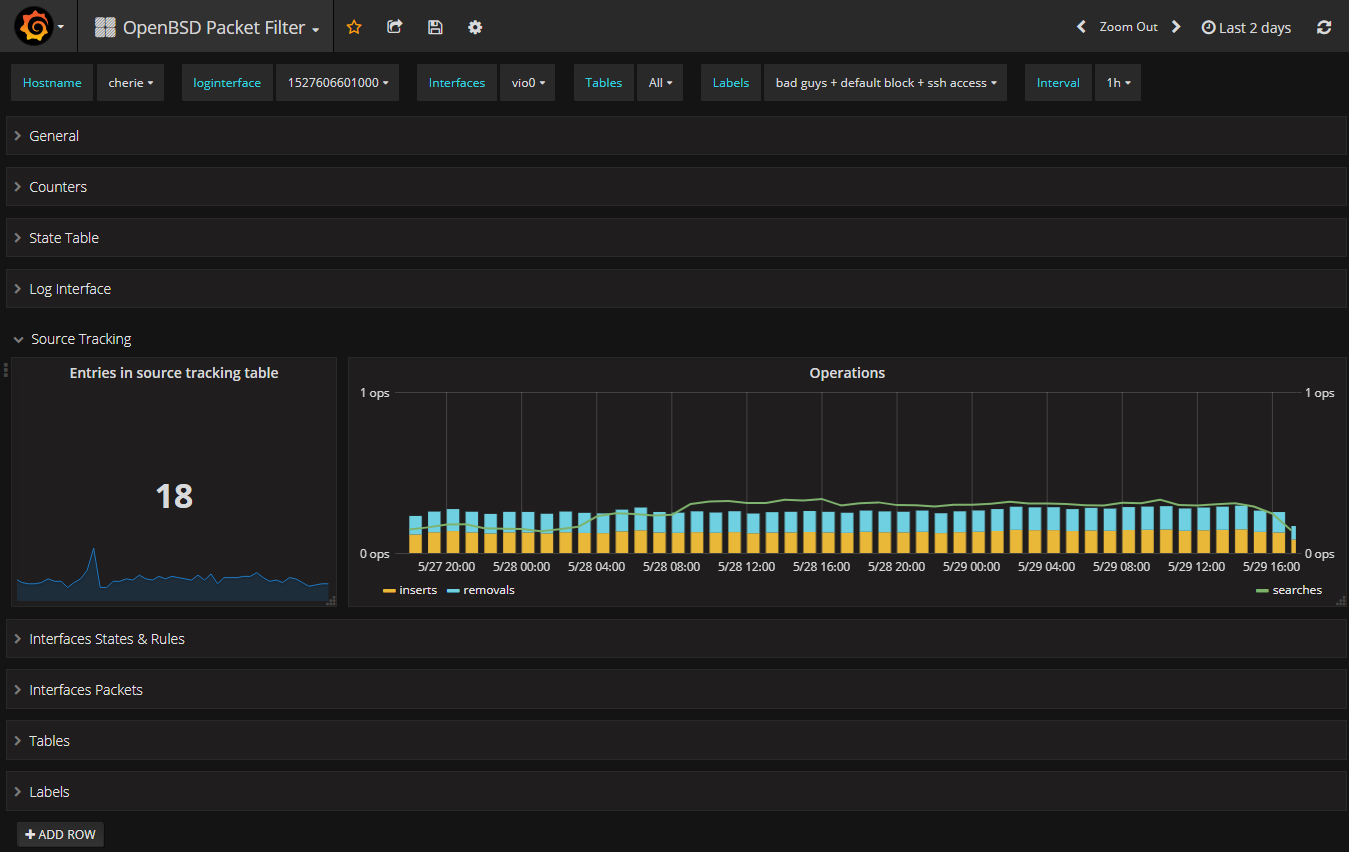
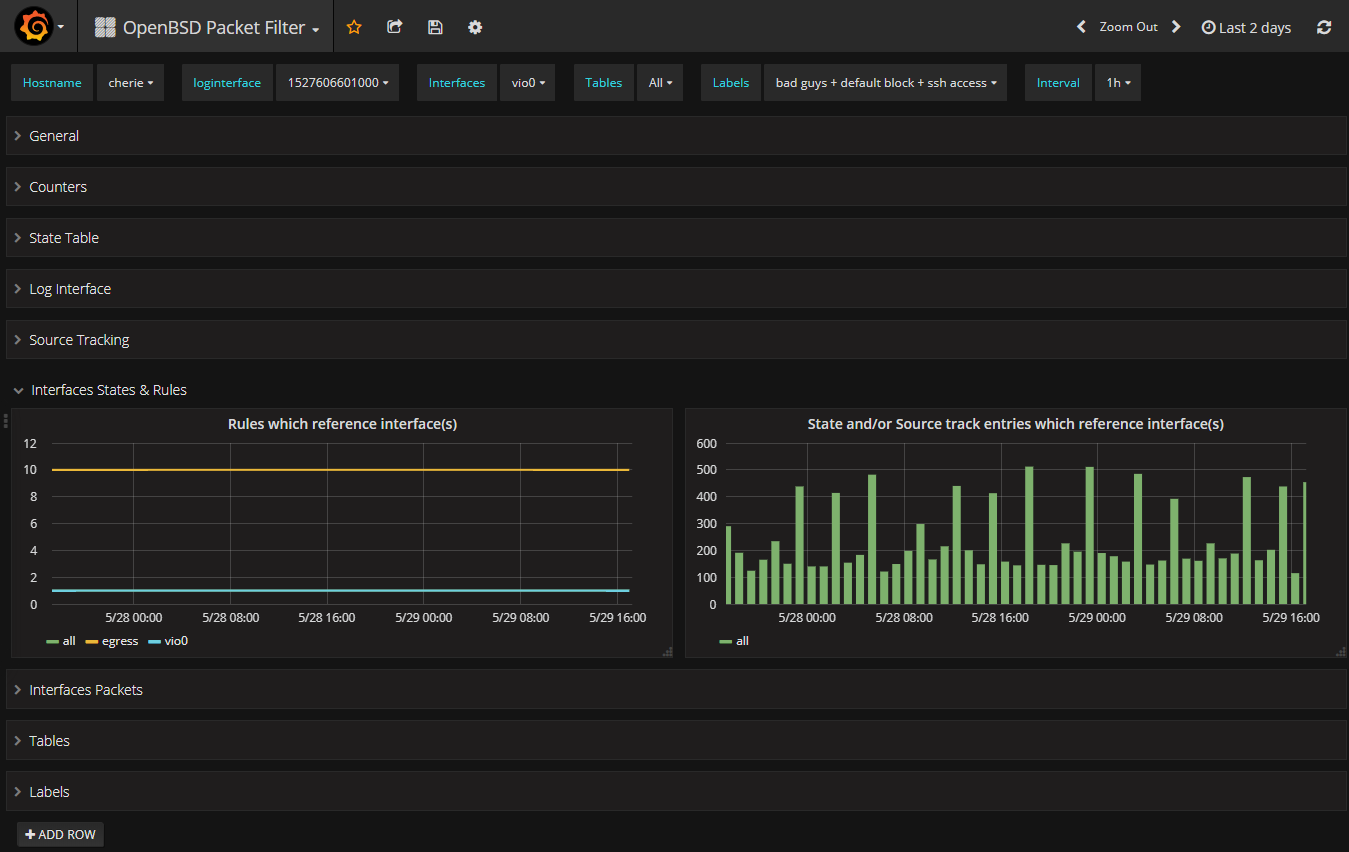
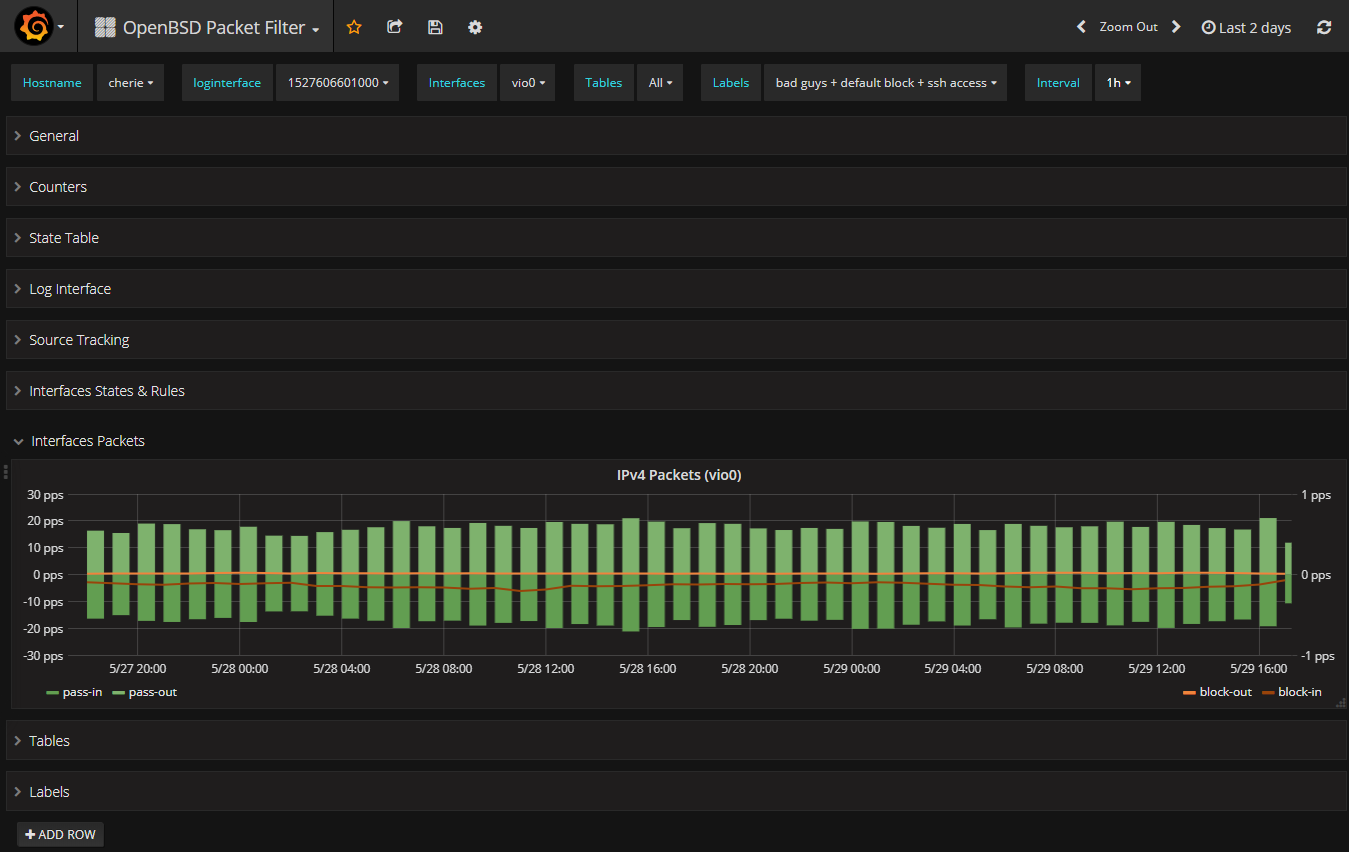
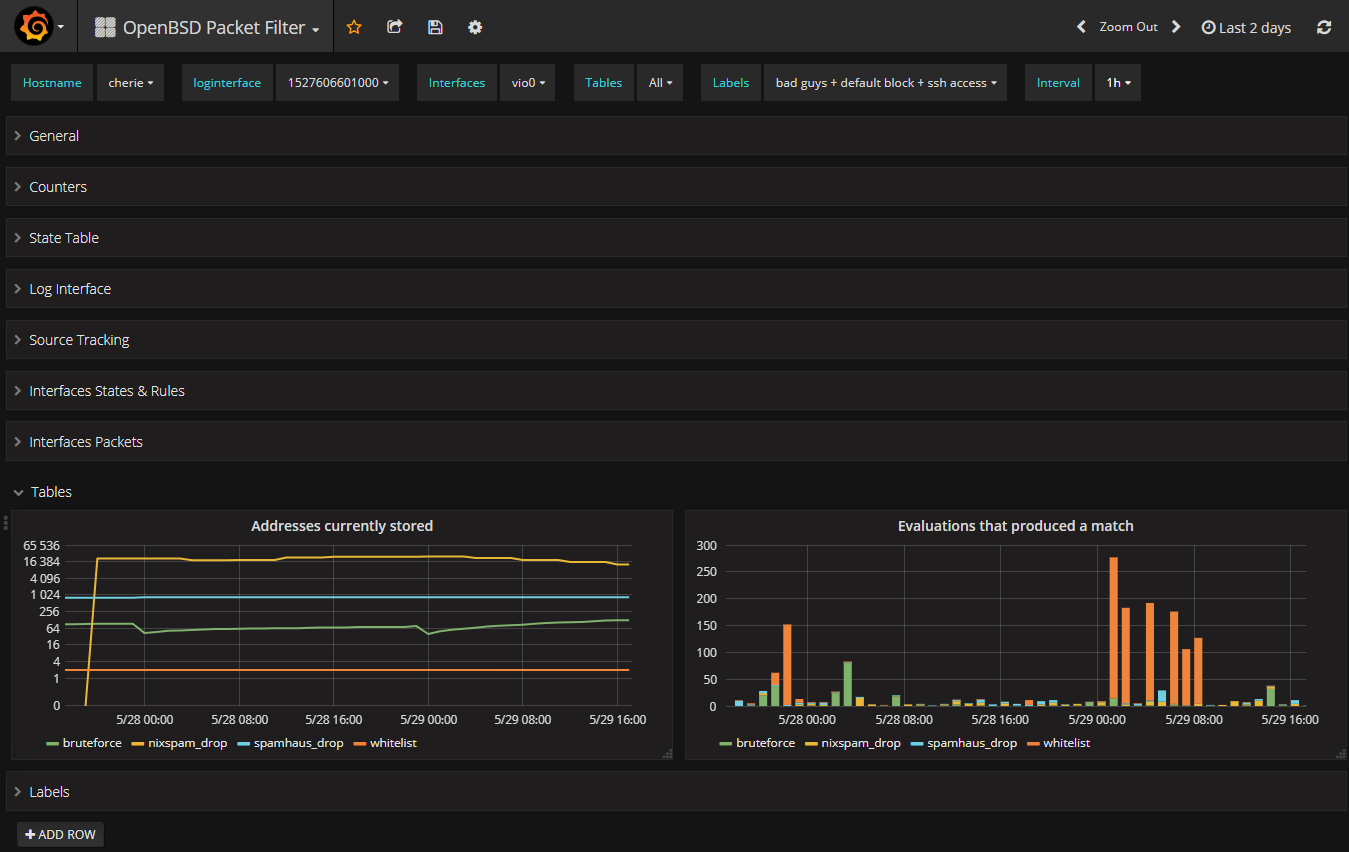
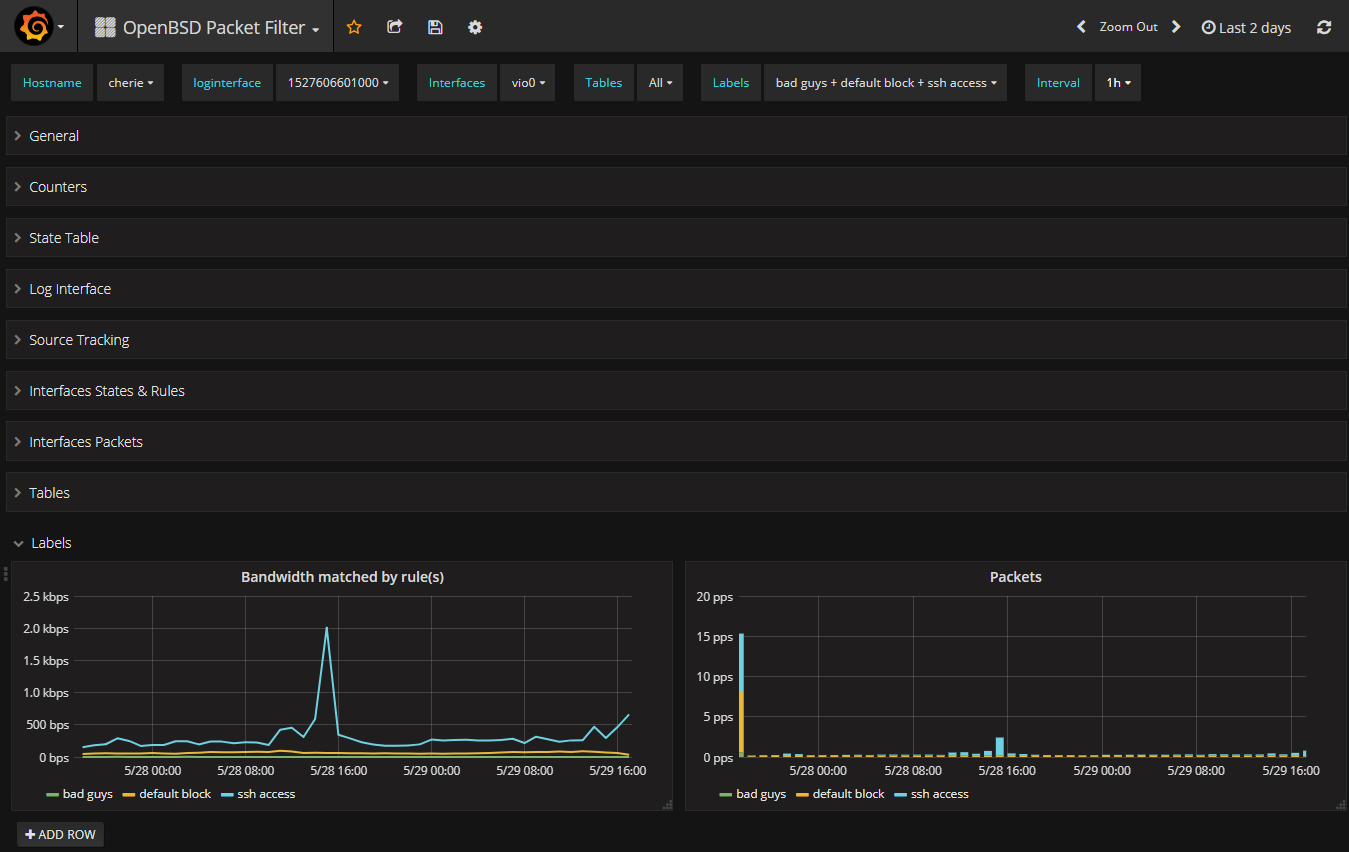
From here, the referenced statistics should be populated into the back-end storage. In my case, an InfluxDB system. I really love Grafana. So this is what I use to render PF stats.
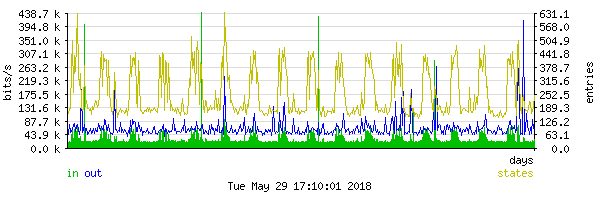
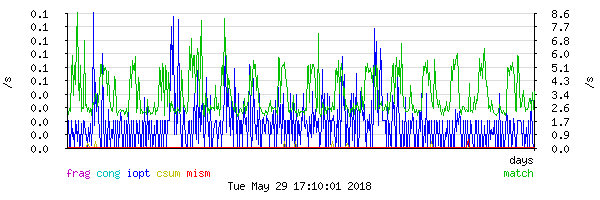
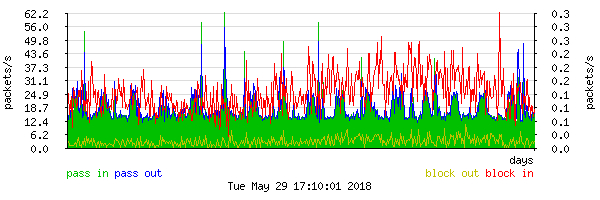
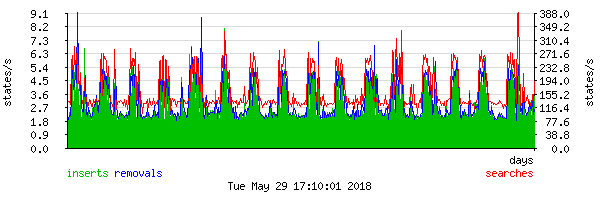
I wanted to check that my stuff was collecting and rendering properly. So I also installed, gathered and rendered using the pfstat(8) utility from ports. Really easy to install and configure.
Luckily, the statistics were coherent!
