Monitoring unbound(8) using Net-SNMP, Telegraf, InfluxDB and Elasticsearch
809 words, 4 minutes
I’ve enabled an OpenBSD unbound(8) daemon that is used as a central DNS cache resolver. Now I needed to know what it was doing and how it performed. The question was answered grabbing statistics from unbound and render them using Grafana.
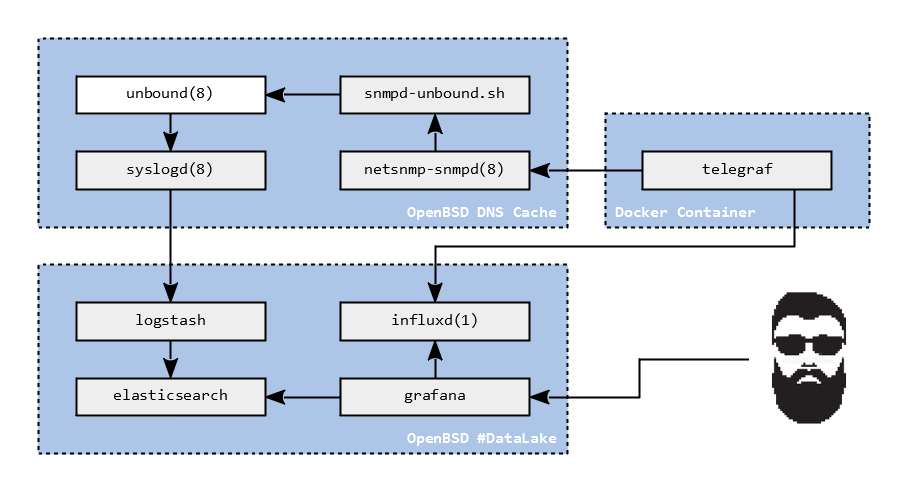
The whole monitoring stack is composed of Net-SNMP, Telegraf and InfluxDB for the metrics part ; and syslogd(8), Logstash and Elasticsearch for the logs part. Of course, most of those run on OpenBSD (6.3) ; except Telegraf, which is not available (yet).
The Big Picture
The logs are send by unbound to the local syslogd. Syslog is configured to forward every messages it gets to a remote logstash. Logstash parses the logs and store them into an Elasticsearch cluster.
The metrics are collected by a remote Telegraf instance, polling the local Net-SNMP daemon, and stored into a remote InfluxDB. The snmpd is configured to execute a local script which runs unbound-control(8) to produce the statistics.
Deliver the logs
Configuring unbound to log into syslogd is quite straightforward:
# vi /var/unbound/etc/unbound.conf
(...)
use-syslog: yes
log-queries: no
log-replies: yes
(...)
The “log-replies” includes the information for queries too. So there’s no need to have both enabled.
Then telling syslogd to forward the logs is no greater pain:
# vi /etc/syslog.conf
(...)
*.* @tcp4://remotelogstash:8514
(...)
Finally, the trickiest part is to configure logstash to parse the logs:
# vi /etc/logstash/conf.d/logstash.conf
(...)
if [program] == "unbound" {
  grok {
    match => {
      "message" => [
        "\[%{INT:pid}:%{INT:thread}\] info: %{IPORHOST:clientip} %{USERNAME:ns_record_name} %{WORD:ns_record_type} %{WORD:ns_record_class} %{WORD:ns_rcode} %{SECOND:time_to_resolv} %{INT:from_cache} %{INT:bytes}",
        # Other messages
        "%{GREEDYDATA:drop-document}"
      ]
    }
  remove_field => ["message"]
  }
  geoip {
    source => "clientip"
  }
  mutate {
    convert => [ "pid", "integer" ]
  }
}
(...)
This allows the logs to be stored and requested via Elasticsearch:
# curl http://localhost:9200/logstash-2018.06.18/_search?pretty\&q=program:unbound
(...)
"hits" : [
  {
    "_index" : "logstash-2018.06.18",
    "_type" : "syslog",
    "_id" : "AWQOMKfG3w2k-psoE21-",
    "_score" : 1.2244513,
    "_source" : {
      "@version" : "1",
      "@timestamp" : "2018-06-18T00:00:08.293Z",
      "type" : "syslog",
      "host" : "cherie",
      "program" : "unbound",
      "facility_label" : "system",
      "severity_label" : "Informational",
      "pid" : 26128,
      "thread" : "0",
      "clientip" : "10.15.5.12",
      "ns_record_name" : "cherie.tumfatig.net.",
      "ns_record_type" : "A",
      "ns_record_class" : "IN",
      "ns_rcode" : "NOERROR",
      "time_to_resolv" : "0.000000",
      "from_cache" : "1",
      "bytes" : "67"
    }
  },
(...)
Ship the metrics
Configure unbound(8) to produce detailed statistics is also simple:
# vi /var/unbound/etc/unbound.conf
(...)
statistics-interval: 0
statistics-cumulative: no
extended-statistics: yes
(...)
Metrics can now be gather using unbound-control. This is what the “snmpd-unbound.sh” script does.
#!/usr/bin/env ksh
#
# Net-SNMP Exec unbound(8) stats
# unbound.conf: "extended-statistics: yes"
#

PATH="/bin:/sbin:/usr/bin:/usr/sbin"
STATFILE="/tmp/snmpd-unbound.txt"

# Generate and store the stats
if [ -z "$1" -o "$1" == "time.up" ]; then
  umask 0177
  doas -u root unbound-control stats > $STATFILE
fi

# Display the stats
RESULT=$(egrep "^$1=" $STATFILE | cut -d '=' -f 2)
[[ -n "$RESULT" ]] && echo $RESULT || echo 0

exit $?
If the script is called without arguments or with the “time.up” argument, then the stats are dumped once in a temporary file. Any other argument will parse the dump file and print that particular stat. This is what net-snmpd does.
# vi /etc/snmp/snmpd.conf
(...)
exec unbound-total.num.queries /home/scripts/snmpd-unbound.sh total.num.queries
exec unbound-total.num.cachehits /home/scripts/snmpd-unbound.sh total.num.cachehits
exec unbound-total.num.cachemiss /home/scripts/snmpd-unbound.sh total.num.cachemiss
(...)
exec unbound-time.up /home/scripts/snmpd-unbound.sh time.up
(...)
exec unbound-num.query.type.A /home/scripts/snmpd-unbound.sh num.query.type.A
exec unbound-num.query.type.AAAA /home/scripts/snmpd-unbound.sh num.query.type.AAAA
exec unbound-num.query.type.ANY /home/scripts/snmpd-unbound.sh num.query.type.ANY
exec unbound-num.query.type.CNAME /home/scripts/snmpd-unbound.sh num.query.type.CNAME
(...)
exec unbound-msg.cache.count /home/scripts/snmpd-unbound.sh msg.cache.count
exec unbound-rrset.cache.count /home/scripts/snmpd-unbound.sh rrset.cache.count
(...)
Telegraf is configured to poll the OID corresponding to the stats I want. Of course, it has to poll “time.up” so that the statistics are regularly updated.
# vi telegraf.conf
(...)
[[inputs.snmp]]
  agents = [ "10.15.5.12:161" ]
  timeout = "5s"
  retries = 3
  version = 2
  community = "unsecured"

  # unbound(8) statistics
  #
  name = "snmp_unbound"

  [[inputs.snmp.field]]
    name = "sysName"
    oid = "RFC1213-MIB::sysName.0"
    is_tag = true

  [[inputs.snmp.field]]
    name = "time.up"
    oid = "NET-SNMP-EXTEND-MIB::nsExtendOutLine.\"unbound-time.up\".1"
    conversion = "float"
  [[inputs.snmp.field]]
    name = "mem.cache.message"
    oid = "NET-SNMP-EXTEND-MIB::nsExtendOutLine.\"unbound-mem.cache.message\".1"
    conversion = "int"
  [[inputs.snmp.field]]
    name = "mem.cache.rrset"
    oid = "NET-SNMP-EXTEND-MIB::nsExtendOutLine.\"unbound-mem.cache.rrset\".1"
    conversion = "int"
  [[inputs.snmp.field]]
    name = "msg.cache.count"
    oid = "NET-SNMP-EXTEND-MIB::nsExtendOutLine.\"unbound-msg.cache.count\".1"
    conversion = "int"
  [[inputs.snmp.field]]
    name = "num.query.class.IN"
    oid = "NET-SNMP-EXTEND-MIB::nsExtendOutLine.\"unbound-num.query.class.IN\".1"
    conversion = "int"
(...)
In the end, the metrics land into InfluxDB.
> SELECT time,sysName,time.up,total.num.cachehits,total.num.cachemiss FROM snmp_unbound WHERE "sysName"='cherie' LIMIT 5
name: snmp_unbound
time sysName time.up total.num.cachehits total.num.cachemiss
---- ------- ------- ------------------- -------------------
2018-05-15T14:25:01Z cherie 2339437.597972 24 3
2018-05-15T14:26:01Z cherie 2339497.445074 5 31
2018-05-15T14:27:01Z cherie 2339557.668106 1 6
2018-05-15T14:28:01Z cherie 2339617.445127 15 20
2018-05-15T14:29:01Z cherie 2339677.444817 4 7
Render and display the truth
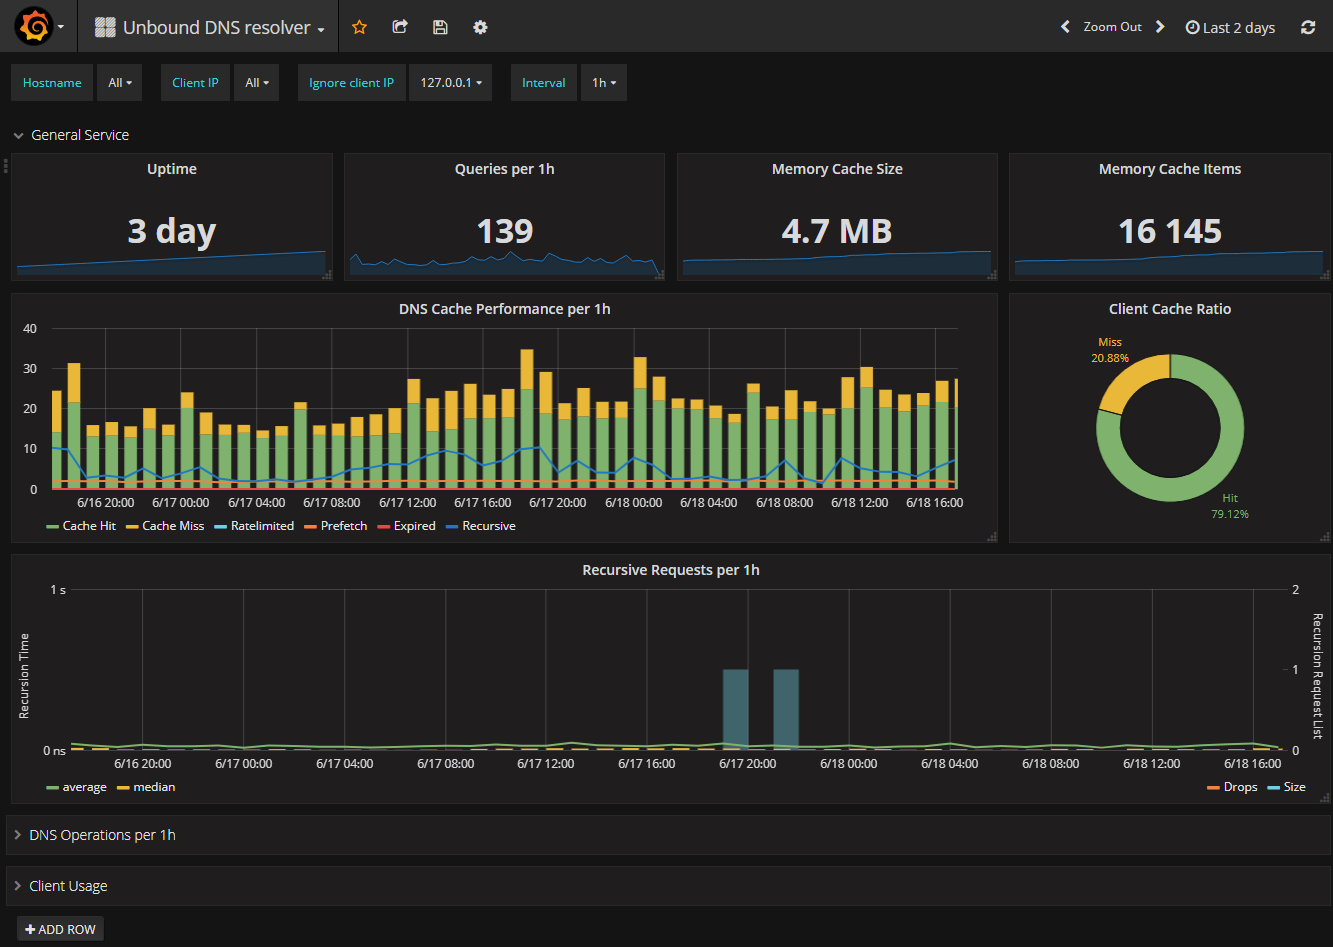
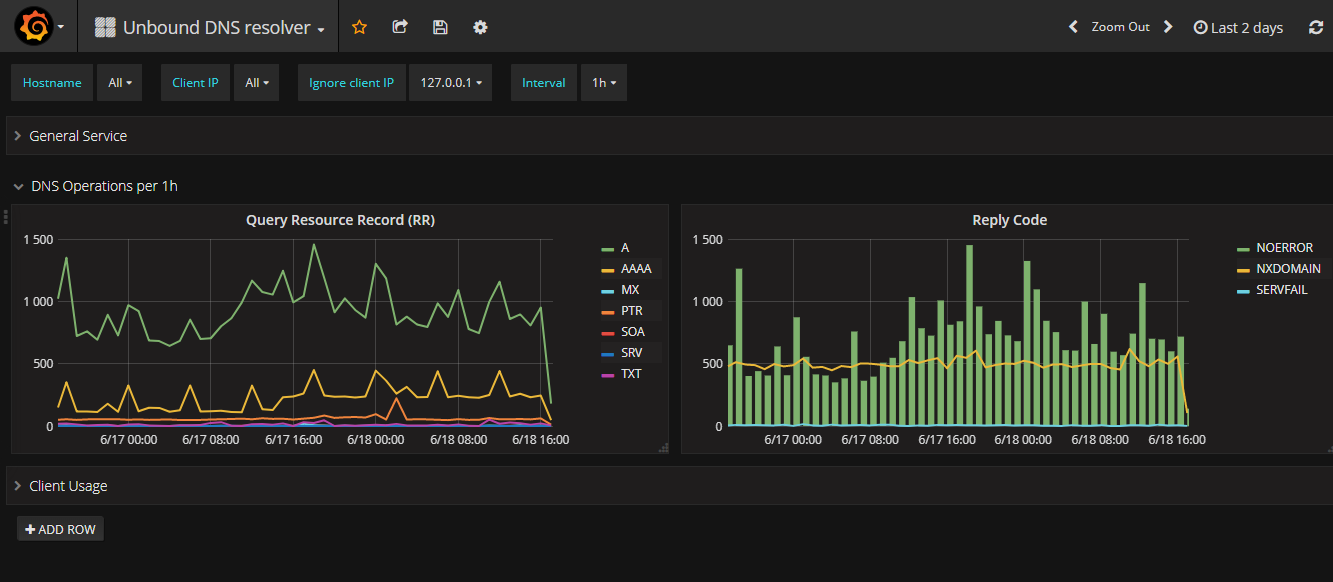
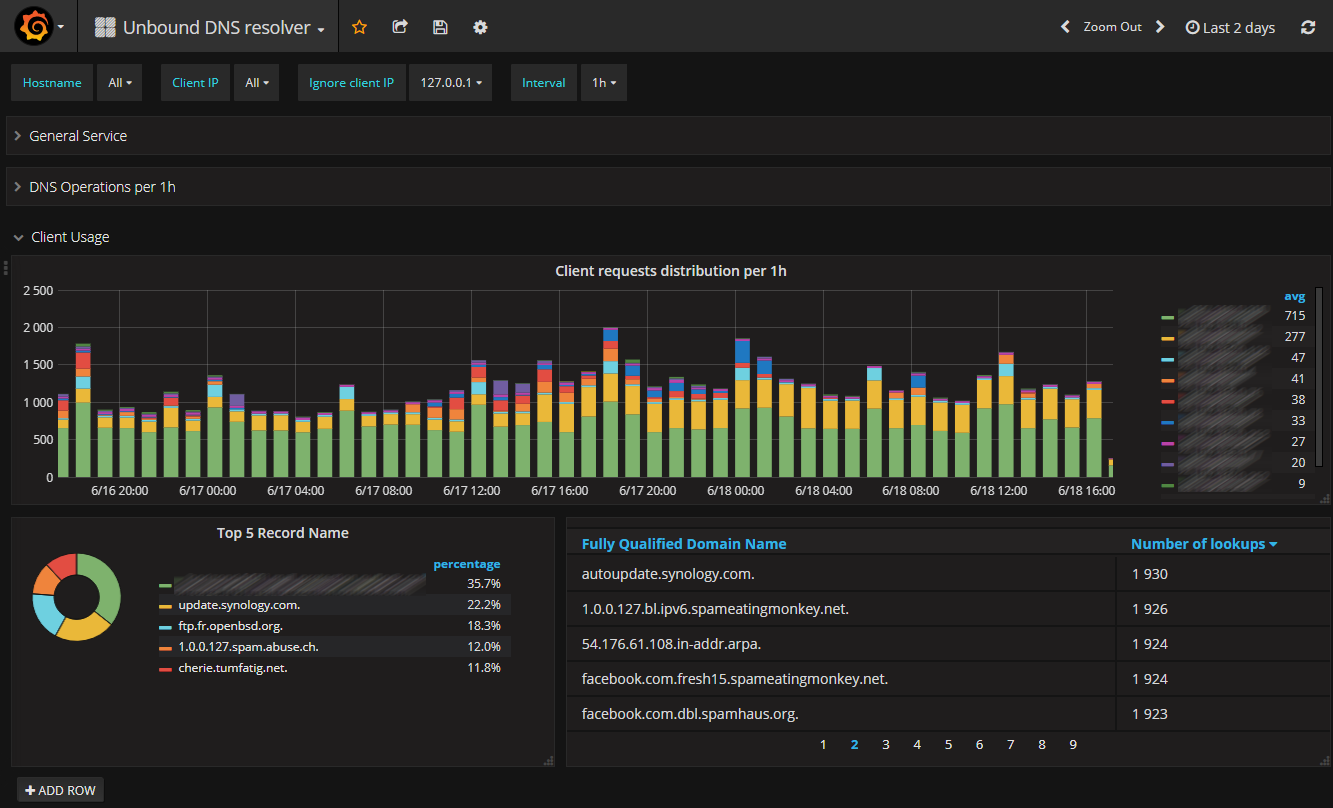
Once the data is stored, it’s time to see what happens every day. I had to build a dedicated dashboard using Grafana ; I found none in the templates. It sources both Elasticsearch (for queries) and InfluxDB (for other metrics). I’m also able to select or ignore specific IP. This allows to check service for servers and/or workstation.
Should you want to use it, I’ll make it available on Grafana’s Dashboards page .
Happy rendering!


