Monitoring OpenBSD using CollectD, InfluxDB and Grafana
357 words, 2 minutes
In a “get pretty graphs” mood, I’m looking at what can be done regarding OpenBSD monitoring using the CollectD collector and Grafana dashboard renderer. OpenBSD 6.2-current provides InfluxDB and Grafana packages. A great stack for pretty reportings.
Host the data
System metrics will be stored in InfluxDB ; because it can be used as a Grafana source. The installation and configuration is straight-forward. The key thing is to enable the collectd protocol.
# pkg_add influxdb
# vi /etc/influxdb/influxdb.conf
(...)
[[collectd]]
  enabled = true
  bind-address = ":25826"
  database = "collectd"
  retention-policy = ""
  typesdb = "/usr/local/share/collectd"

# rcctl enable influxdb
# rcctl start influxdb
Note that this service works using UDP only. Unless I missed something, at the time of writing, there is no TCP nor TLS available options.
# netstat -na | grep 25826
udp 0 0 *.25826 *.*
Collect the data
I’m using CollectD as a metrics collector. Mostly because it knows about OpenBSD and is able to send its data remotely. In this case, to InfluxDB. Enable any required plugins. Don’t forget the network one so that data are send to InfluxDB.
# pkg_add collectd
# vi /etc/collectd.conf
(...)
<Plugin network>
  <Server "127.0.0.1" "25826">
  </Server>
  ReportStats true
</Plugin>

# rcctl enable collectd
# rcctl start collectd
Render the data
New in OpenBSD 6.2-current : Grafana is available as a binary package. This will enable pretty graphing using my prefered OS.
# pkg_add grafana
# vi /etc/grafana/config.ini

# rcctl enable grafana
# rcctl start grafana
Browse to http://localhost:3000/ and log in using the default credentials (admin:admin). Those can be changed this way http://docs.grafana.org/installation/configuration/#security and from the GUI.
In Grafana, add the InfluxDB source using the collectd database.
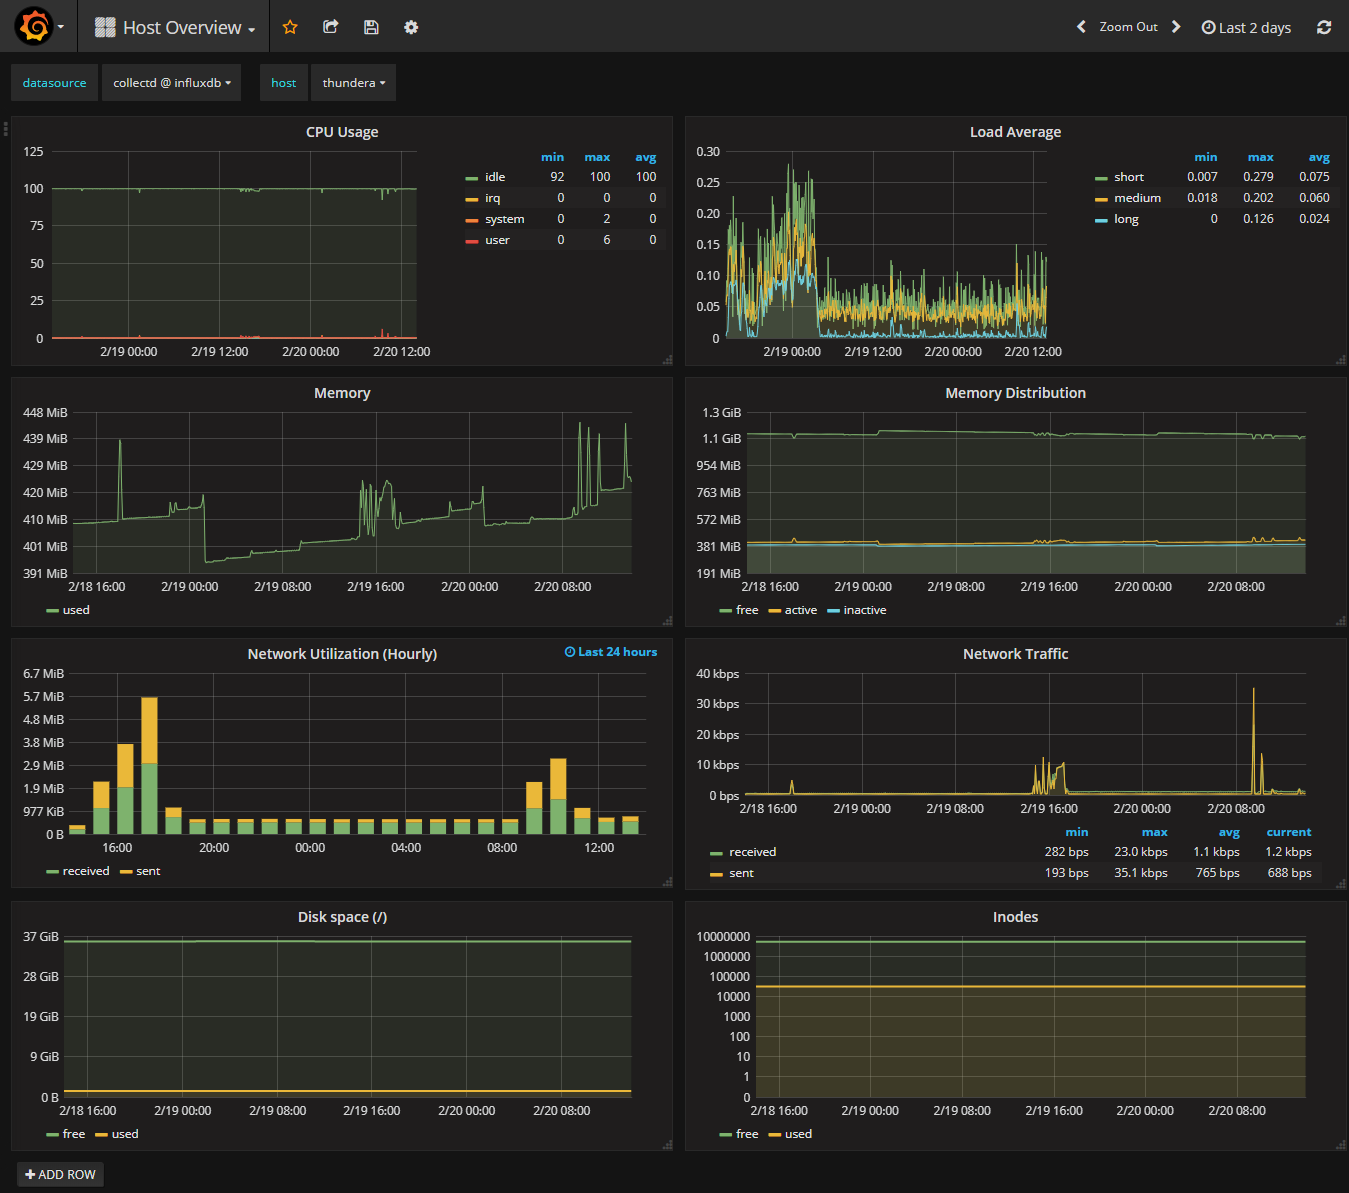
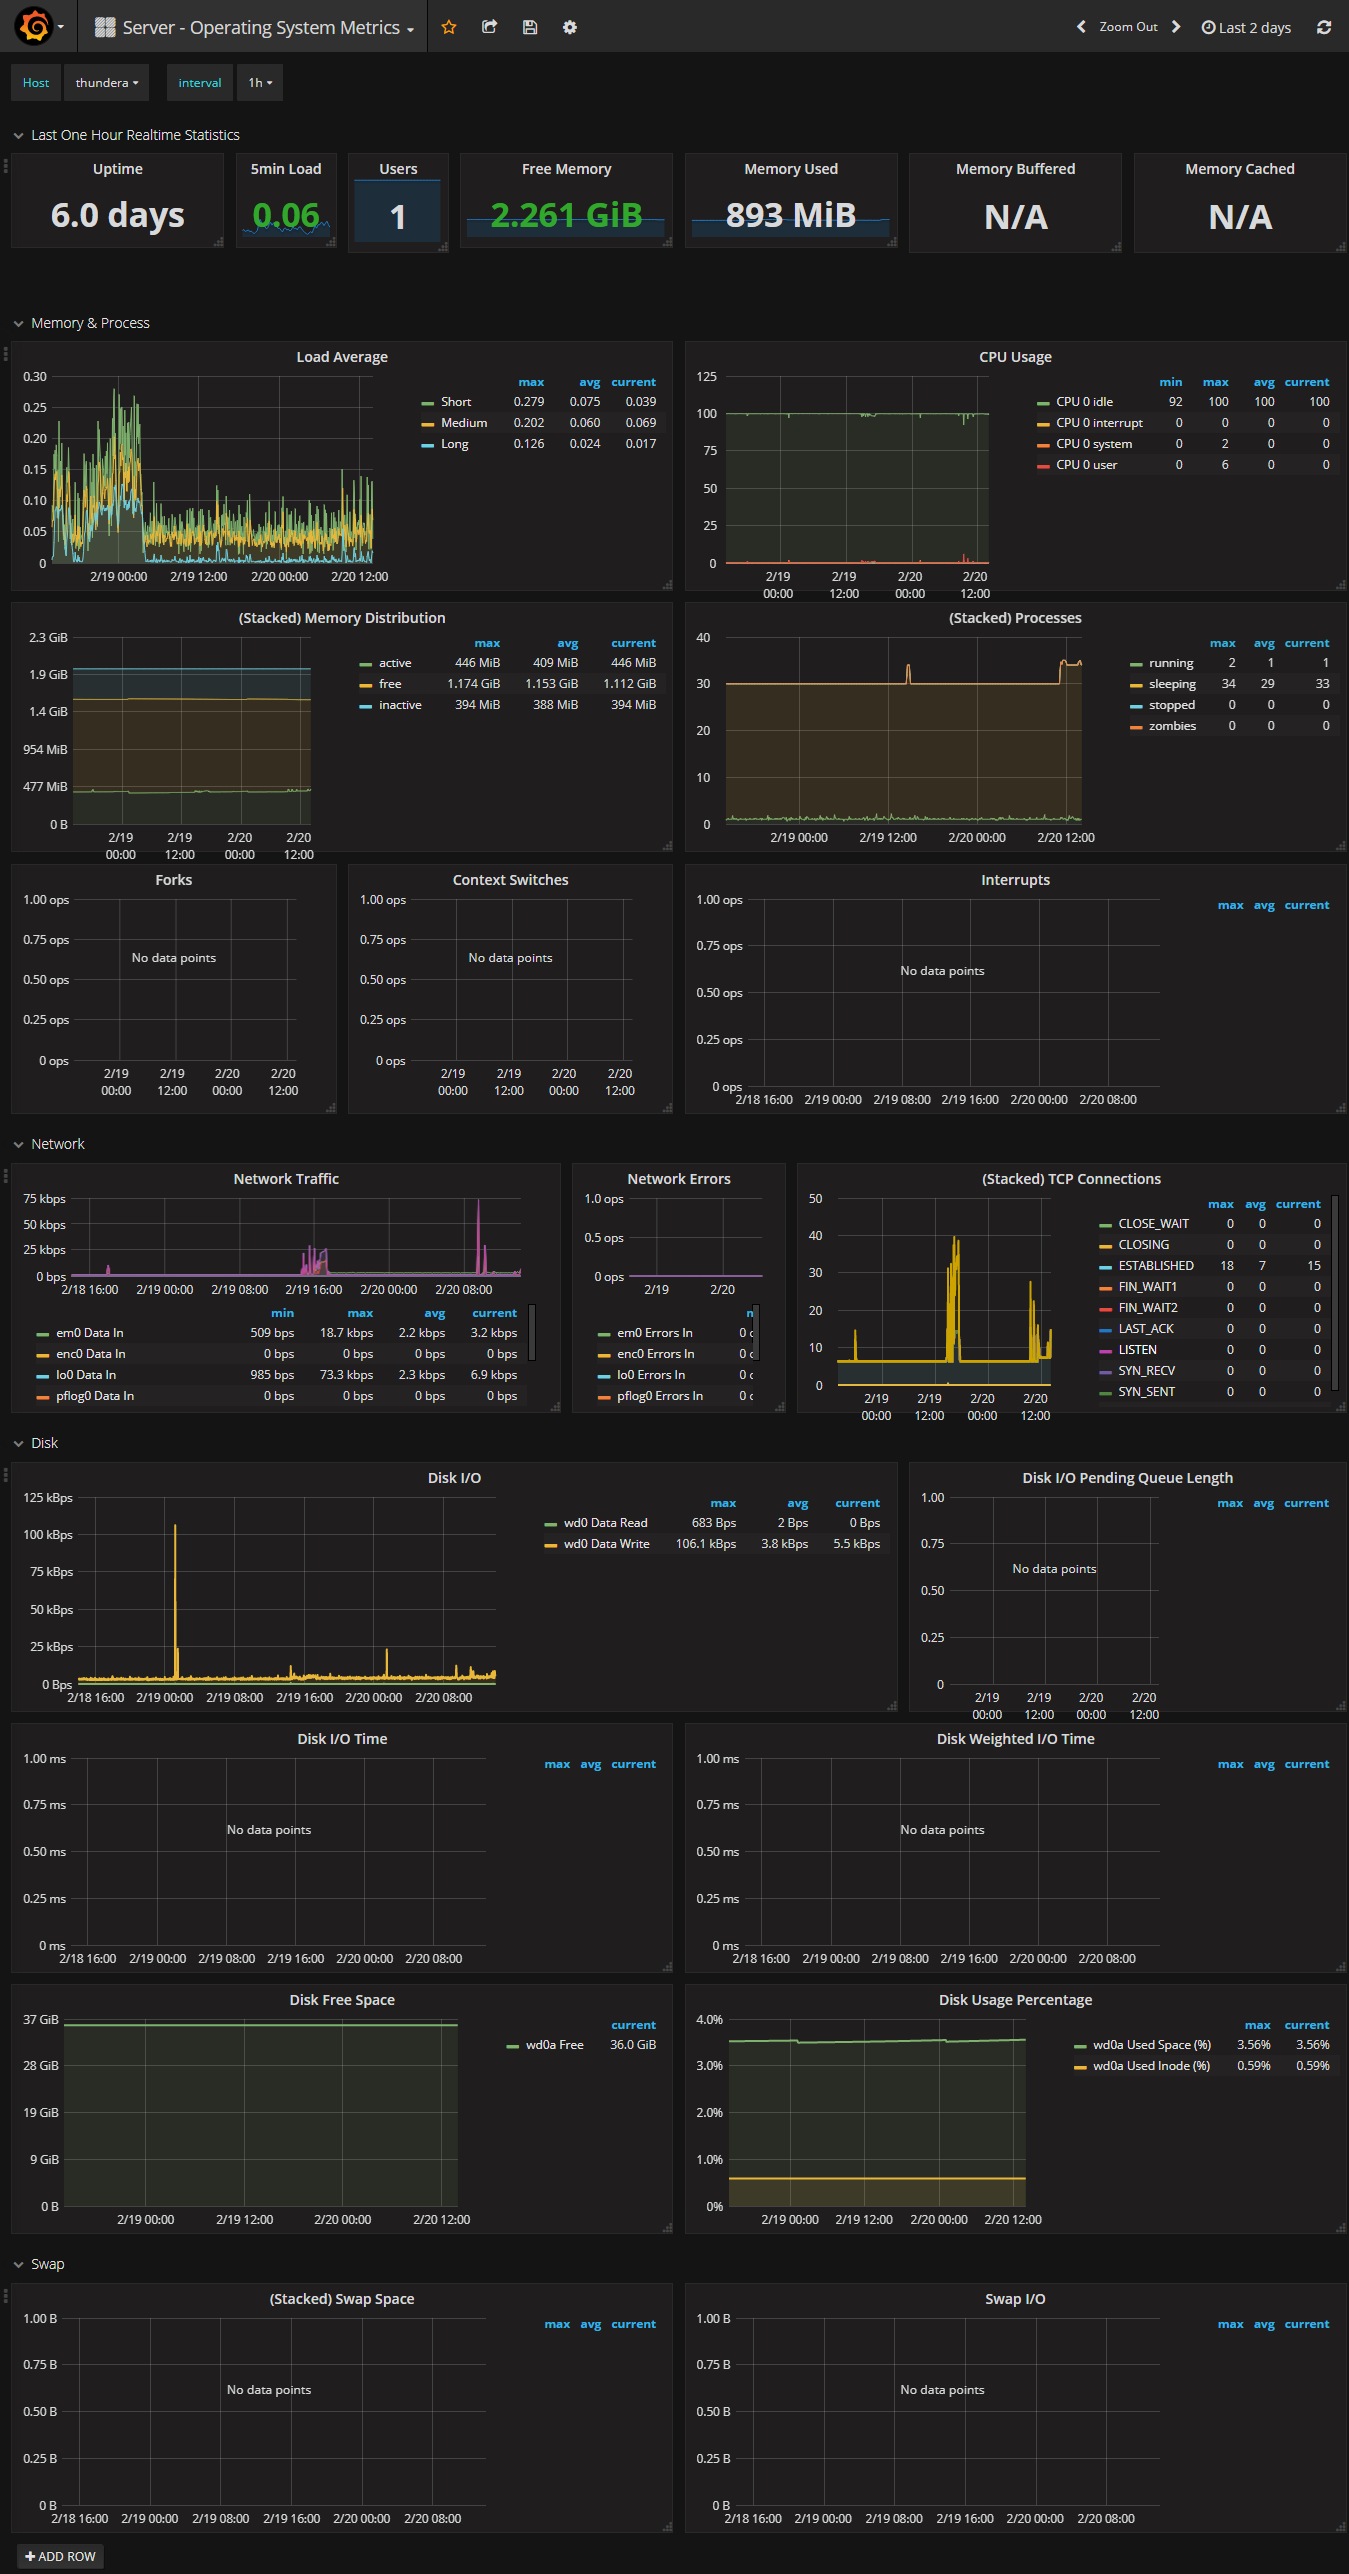
There are example dashboards available from Grafana’s website. Namely #554, #555 and #755. They will nearly work out-of-the-box and can be used as a base to create yours. They seem to be Linux-centric but here’s how they look, once slighty modified for OpenBSD.
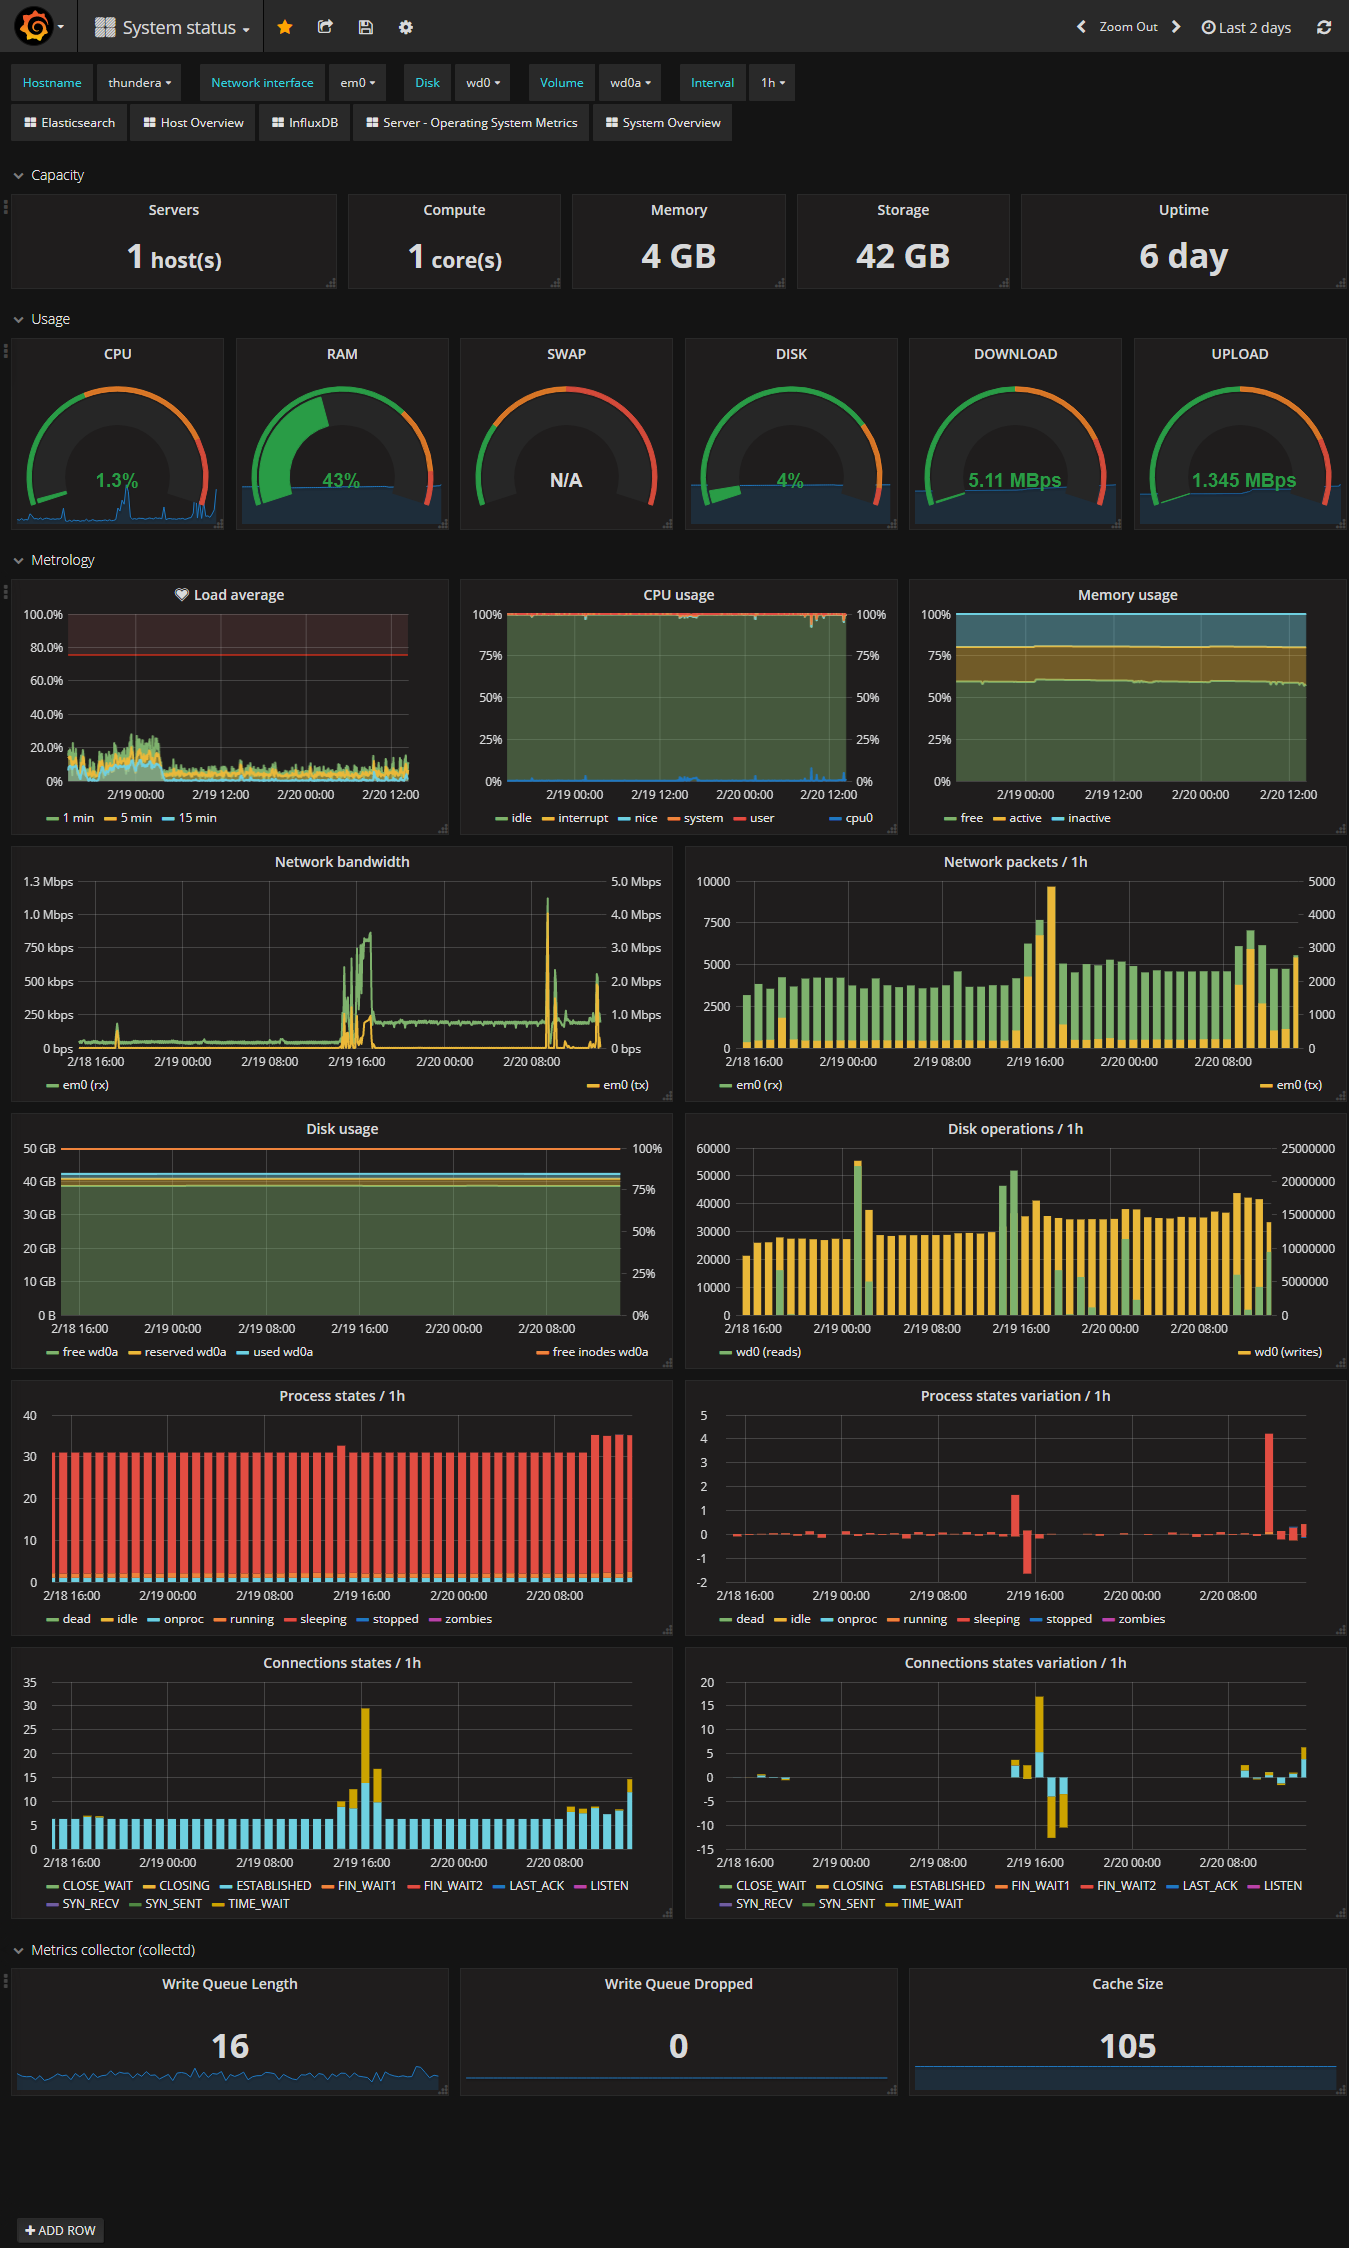
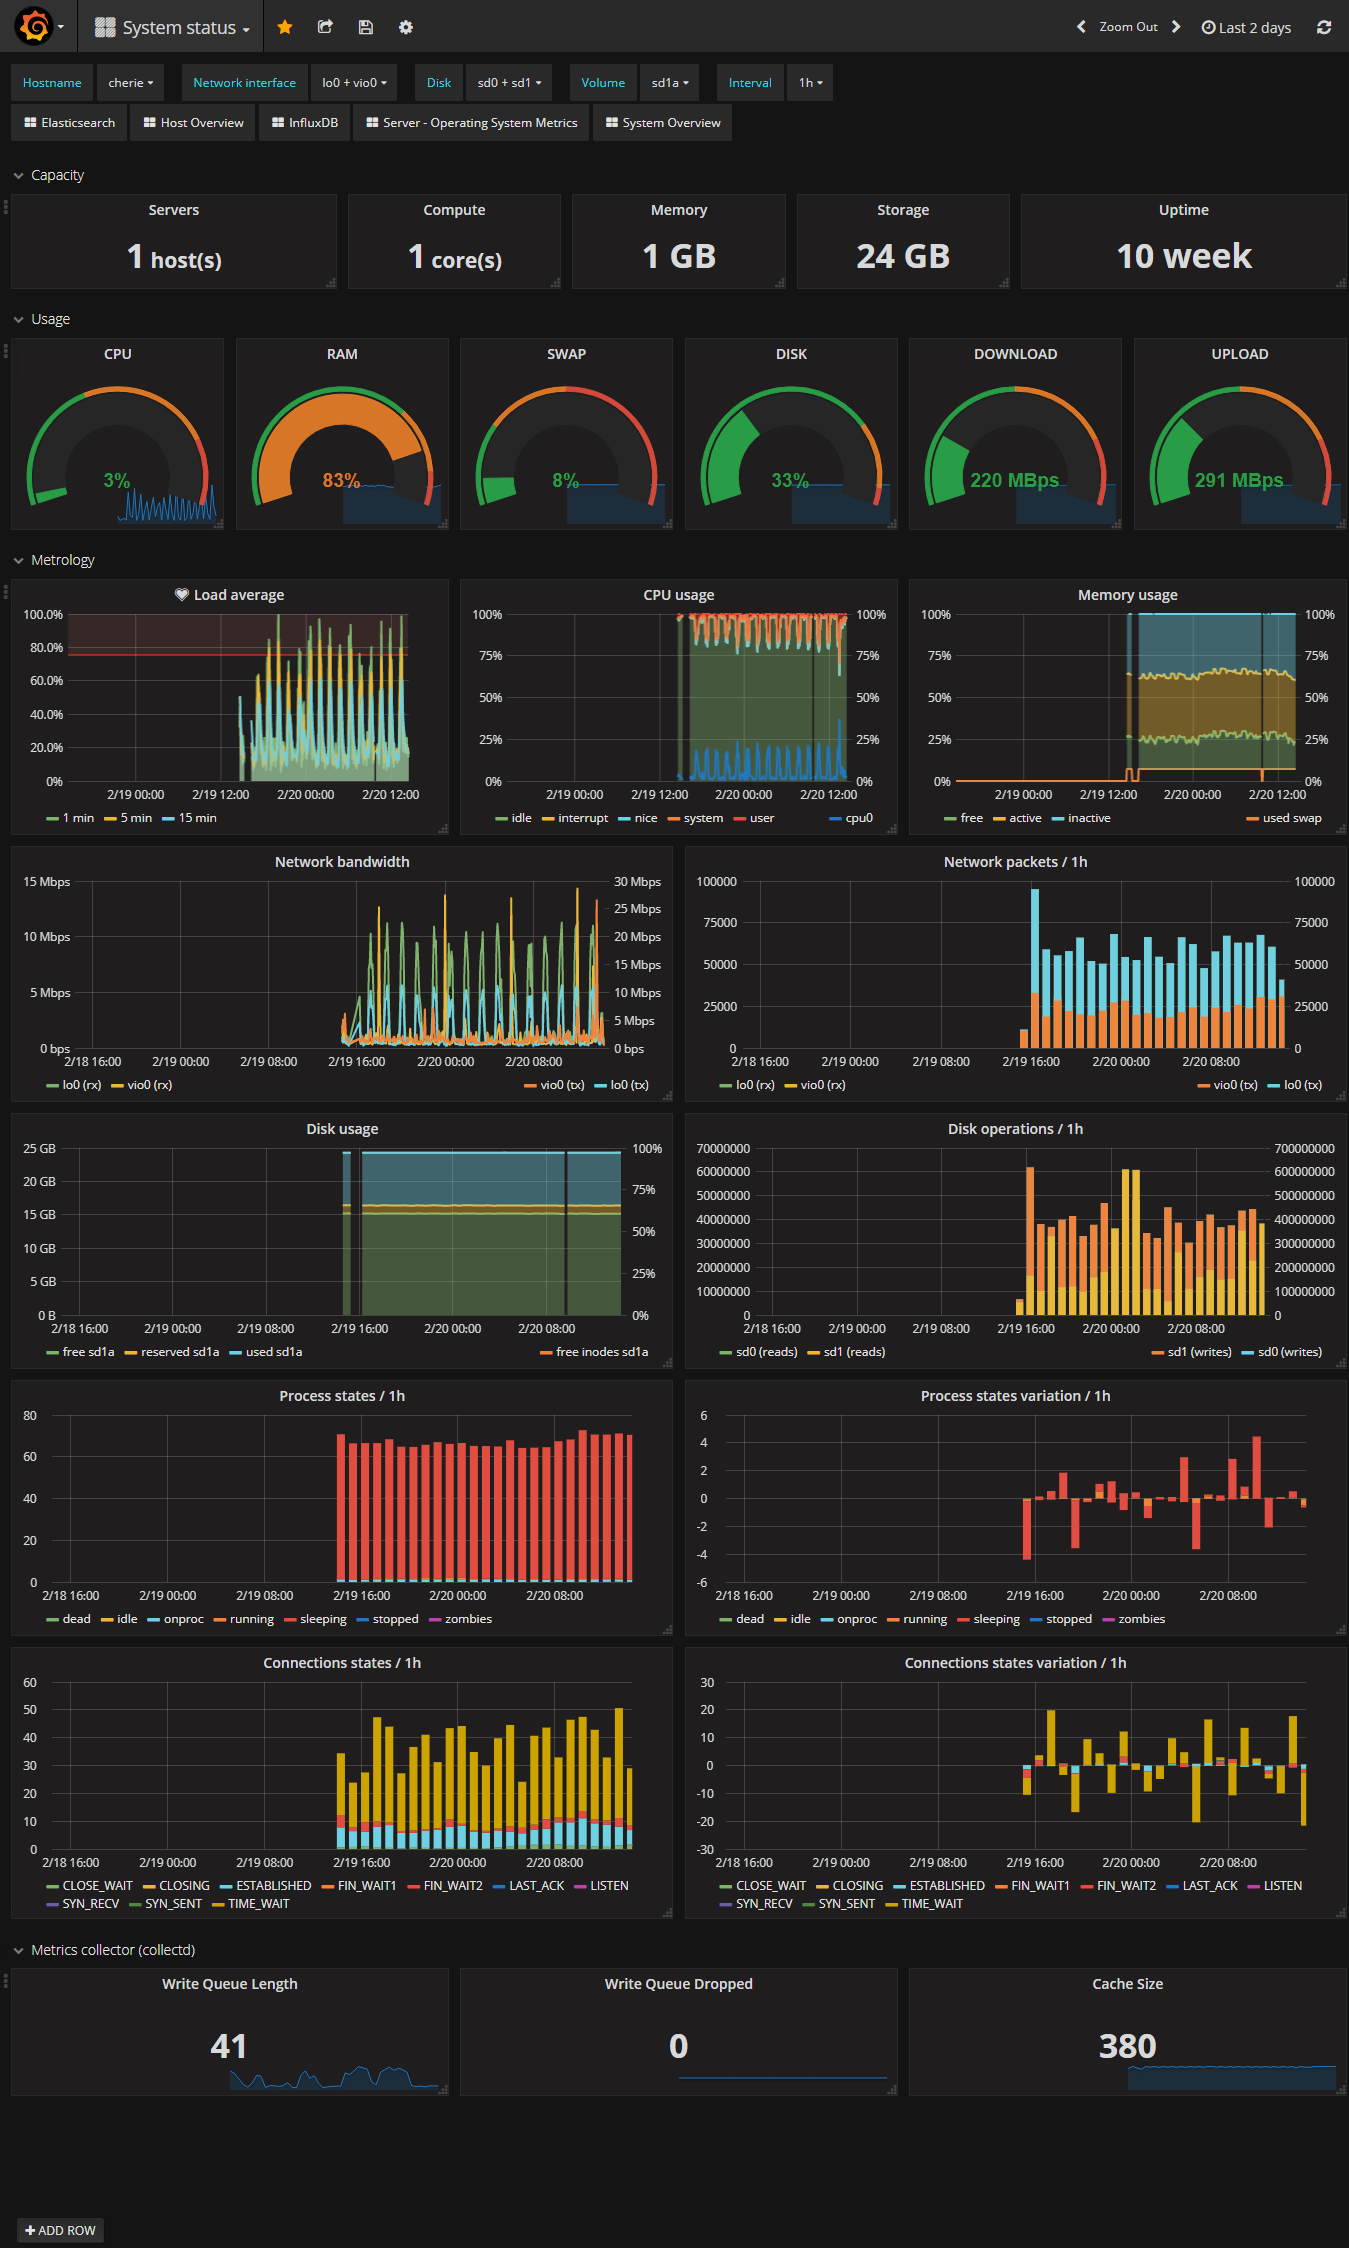
I’ve created one from scratch to render default collect data from my OpenBSD servers. It looks like this :
Should you want to use it, I have made it available online here .
That’s All Folks!


