Quick tour of the Veeam ONE 6 for VMware and Hyper-V
984 words, 5 minutes
Part of my daily job is checking clients infrastructure health. Most of them have VMware vSphere, some have Hyper-V. I use a home-developed set of tools to gather, compute and report performance and health data and metrics. Quoting Veeam ONE for VMware and Hyper-V homepage: “(…) Veeam ONE is a single solution for powerful and easy-to-use monitoring and reporting for VMware and Hyper-V. It provides complete visibility of the virtual infrastructure and affordably delivers the capabilities that matter most to virtualization administrators”. Read the official homepage for more information.
Here I’m going to have a quick look at what Veeam ONE 6 does, how and if it’s worth it.
What you need
This tour will use the VMware vSphere environnement:
- An hypervisor: me using VMware ESXi 5, free edition/licence ;
- A Windows machine: I used a virtual Windows 7 machine ;
- The Veeam ONE installation package: I downloaded the ISO from the website, using no licence.
I wasn’t sure about if I needed some licence on the ESXi and/or some vCenter. The answer is “NO, you really don’t need it”.
Installation
The installation process is well described in the “Veeam ONE, Version 6.0, Deployment Guide (Rev 3)” PDF file. You can download it from Veeam’s website since you registered a (free) account. Bascially, log-on the Windows machine, plug the ISO, install Veeam ONE Server and Veeam ONE Monitor Client. In my particular case, I installed both in a Windows 7 x64 instance using 2 vCPU and 4GB of RAM.
The only difference from the documentation is that, since I don’t have a vCenter, I can’t configure it during installation. At the “Virtual Server Type” selection step (page 22), select the “Skip Virtual Server configuration” option. If you have a vCenter, you can configure it during the installation process.
Once installed, launch the “Veeam ONE Monitor” and use the “Add Server” button to connect to the ESXi server.
What you get
Veeam ONE Monitor
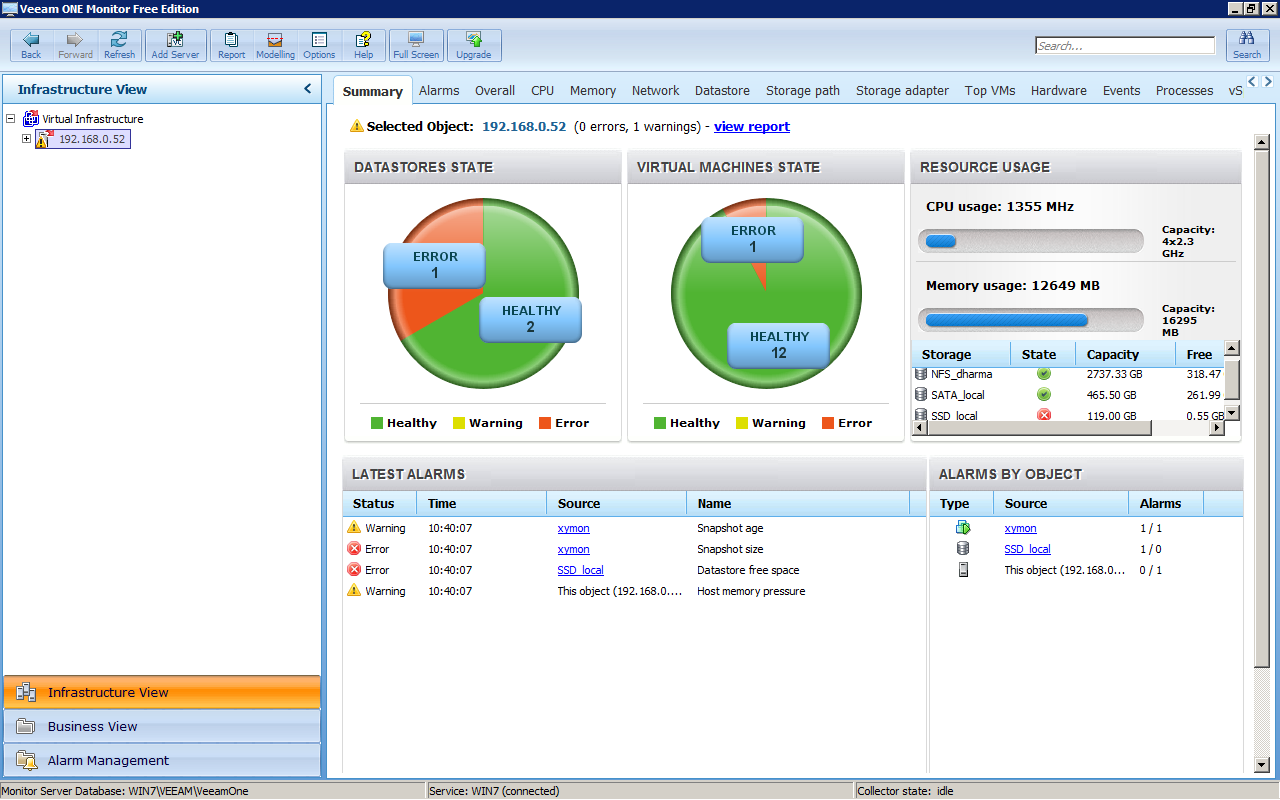
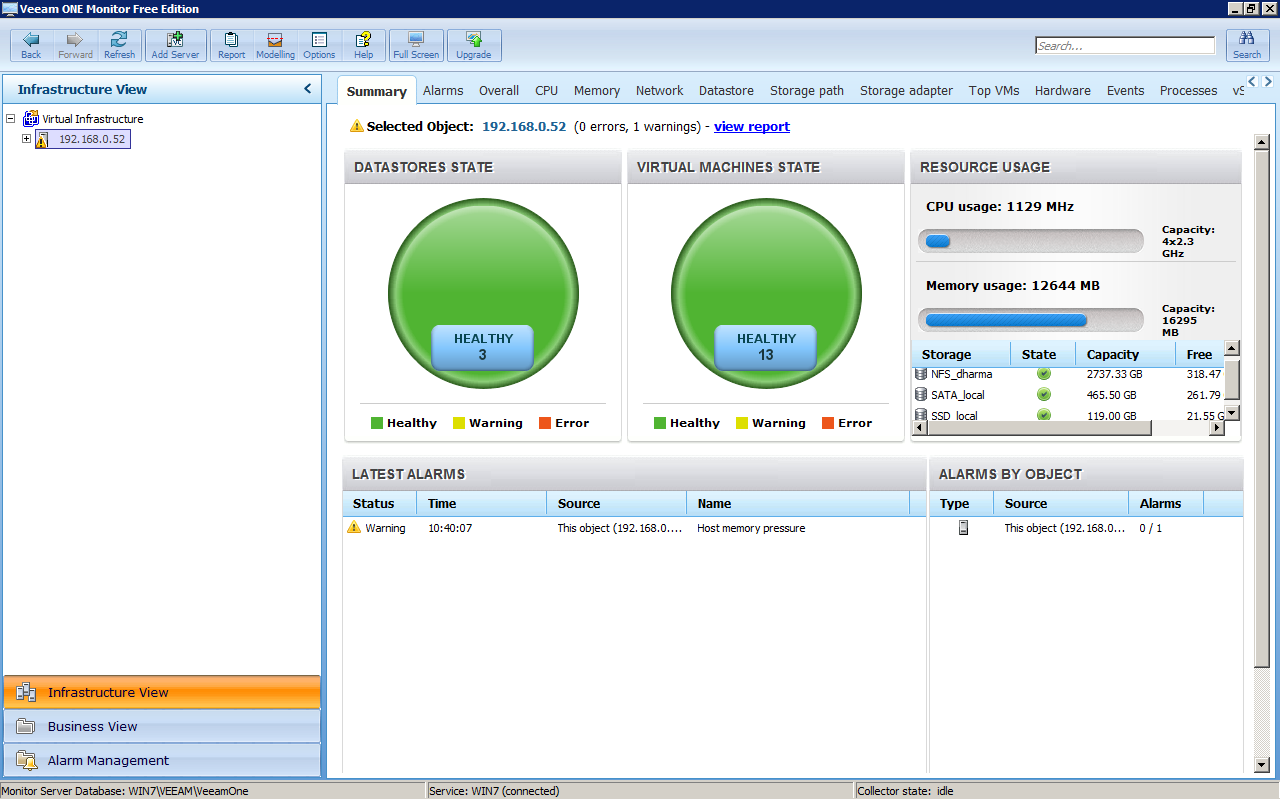
Using the “Veeam ONE Monitor”, you can get information about the ESXi environnement in less than a minute. In my particular case, I got notified that “Memory Pressure” was above the defined threshold (94% vs 80%), that some datastore were nearly full and that one VM had a snapshot lying there for a long time.
ESXi memory and datastore size is no surprise. But I must admit that I forgot that snapshot on the VM that I was running tests with. So I use the vSphere client to destroy the snapshot that I don’t need any more. I also had a second look at why the datastore was full ; shouldn’t be. Well done ONE!
From the “Alarms” tab of the ONE Monitor, you can get details about errors and warnings. The information panels gives a quite complete description of the error, why it may happen (or just happens) and what to do to solve the problem.
The “Overall”, “CPU”, (…) and “Storage Adapter” tabs presents various live monitoring metrics from the past hour. In fact, those are nearly the same as those you get from the vSphere Performance tab. In my opinion, those metrics are better presented in ONE Monitor. Just because vSphere client is a bit like “here’s the bucket of numbers” whereas ONE Monitor displays them in a more intelligible way.
The “Top VMs” tab shows the top 3 VM which consumes most resources. Displayed resources are CPU usage, consumed memory, network usage, datastore usage and swapped memory. This is a nice way to identify a virtual machine that uses either all or much of the ESXi resources. In my case, I had the surprise to see the Munin ancient machine using more CPU that the Xymon new machine ; I’m moving monitoring from Monit+Munin to Xymon.
The “Hardware” tab sums up what the “Hardware Status” tab of the vSphere client displays in a various of drop-down boxes. Once again, for the daily operation lookup, this is “better” done on the ONE Monitor.
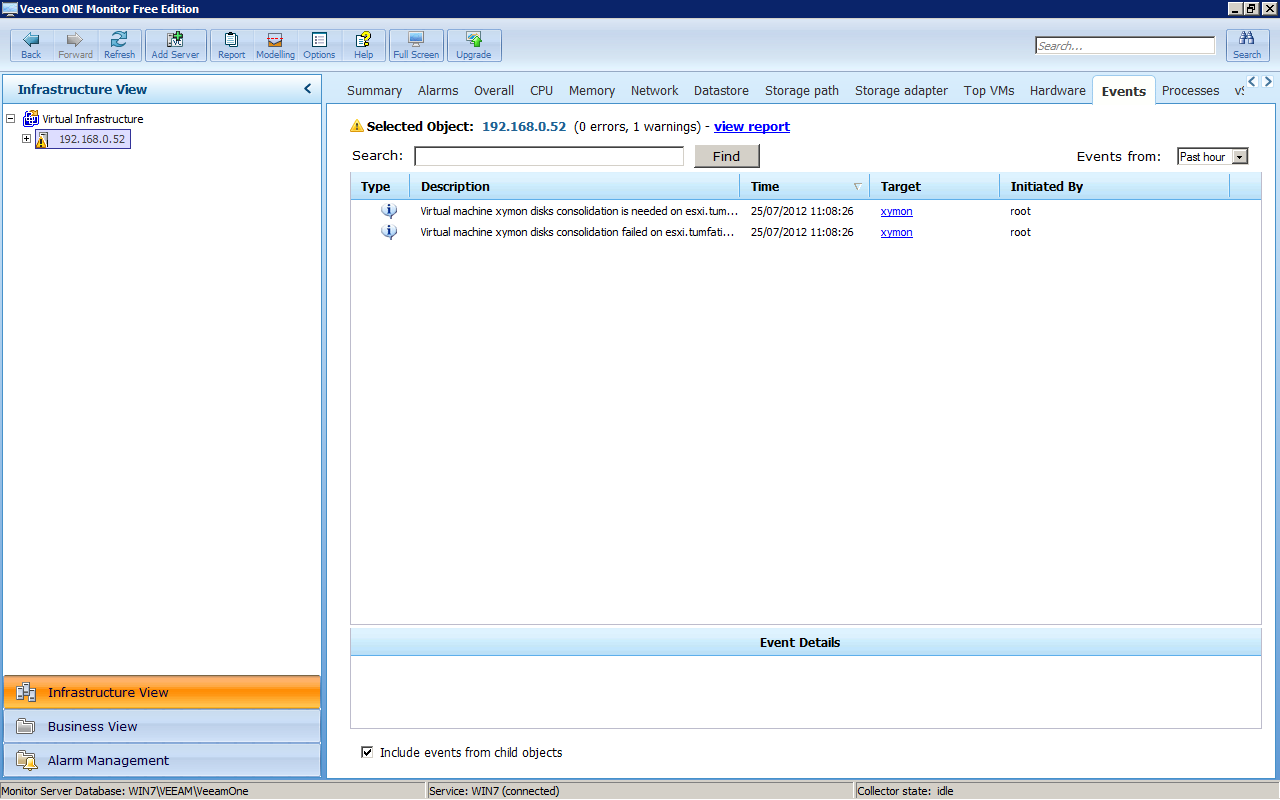
The “Events” tab lists errors and warnings.
Veeam ONE Reporter
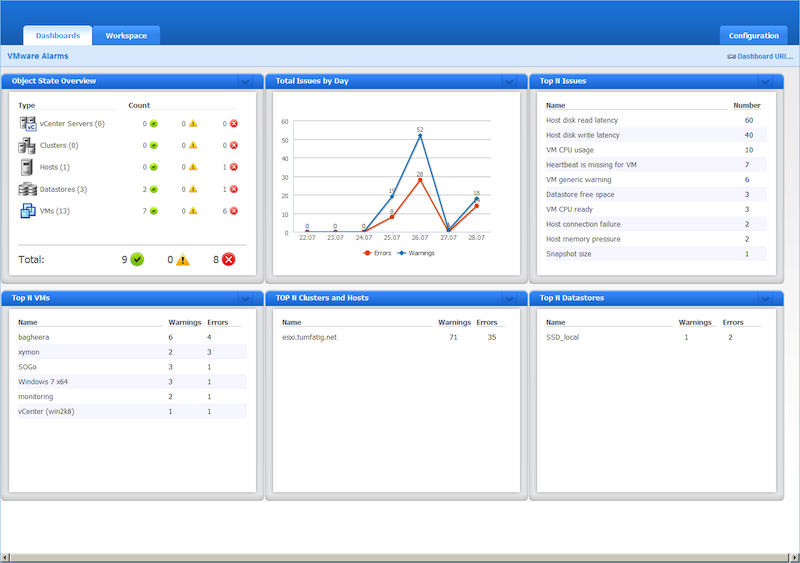
It’s a Web tool that is more statistics oriented. In the Free Edition, reporting data is limited to 24 hours only. It is quite enough for a day to day usage but would really deserve the licensed version to generate monthly reporting for your CEO.
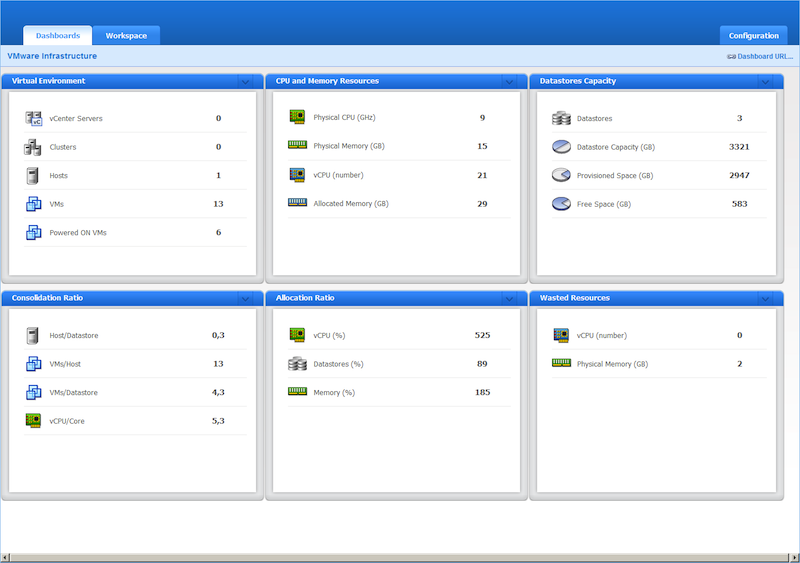
The free version only provides “VMware Alarms”, “VMware Infrastructure” dashboards. Every other require the full version.
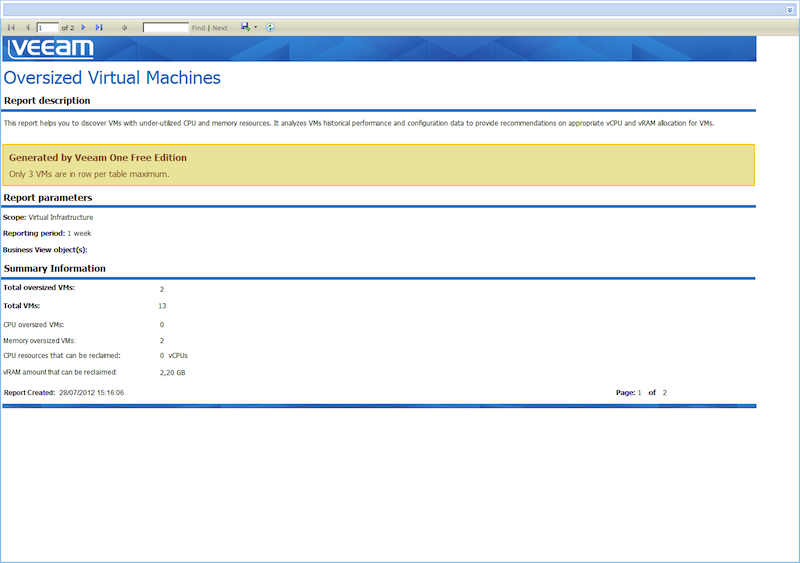
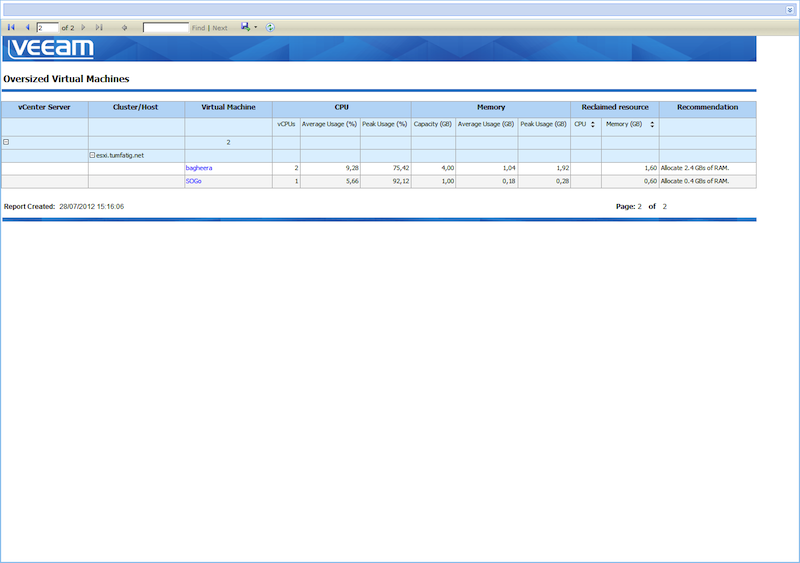
I really like the “Wasted Resources” report ; although it only reports 3 VM. It is a good way to check and tune your VM according to what you thought they would do at provisioning time and what they really do (and consume).
I want more!
Since I really liked the product, I asked for a 30-day evaluation license.
To upgrade from the Free Edition to the Trial Edition, launch the Veeam ONE Monitor, select the “Help” menu and the “License Information” item. Click the “Install License” button and browse to the .lic file you received.
According to the “Veeam ONE: Free vs Full” document, the main difference between Free and Full editions are:
- Advanced deployment scenario ;
- More report and alert templates ;
- Performance data not limited to last 24 hours ;
- VM reports not limited to 3 top VM ;
- More dashboards.
All I had a look at was the “new” dashboards and full VM reports.
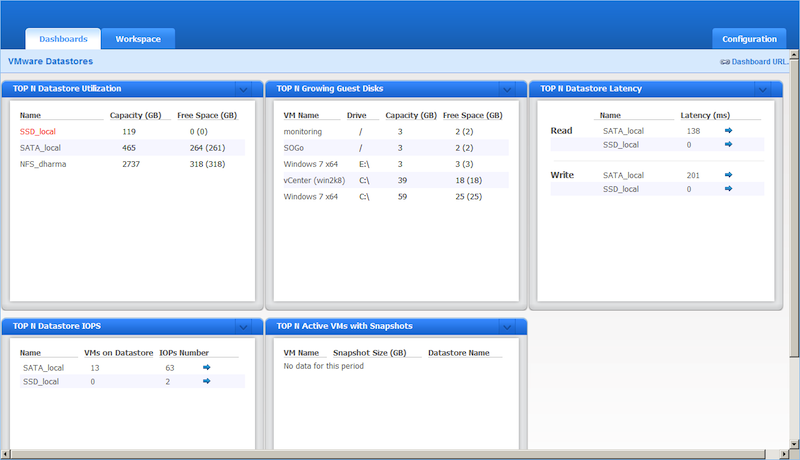
Indeed, the “VMware Datastores” and “VMware VMs” are usefull, even in my case ; that is one single ESXi with local and remote NFS datastores.
I’ll have to wait for a full week to look at the reporting features of the Full Edition. Will report later.
