Monitor Synology disk temperature from SNMP
595 words, 3 minutes
I’m always looking at how to get informations from my I.T. systems ; although it often ends they do nothing…
Here’s a trick to monitor the disks temperature of a Synology NAS (DS409slim in my case).
Enable monitoring on the Synology
First of all, we’ll need the smartmontools. If you don’t already have it,
install it using ipkg:
  # ipkg install smartmontools
  # which smartctl
  /usr/syno/bin/smartctl
Once done, let’s try to find the devices:
  # smartctl --scan
  /dev/hda -d ata # /dev/hda, ATA device
  /dev/hdb -d ata # /dev/hdb, ATA device
  /dev/hdc -d ata # /dev/hdc, ATA device
  /dev/hdd -d ata # /dev/hdd, ATA device
  (...)
  /dev/sda -d scsi # /dev/sda, SCSI device
  /dev/sdb -d scsi # /dev/sdb, SCSI device
  /dev/sdc -d scsi # /dev/sdc, SCSI device
  /dev/sdd -d scsi # /dev/sdd, SCSI device
  (...)
I don’t know why it lists both ATA and SCSI disks… Maybe because I have SATA disks… Anyway, let’s see if the disk answers to information requests:
  # smartctl -a /dev/hda -d ata | egrep "Model|Temp"
  Model Family:     Toshiba 2.5" HDD MK..59GSM (Adv. Format)
  Device Model:     TOSHIBA MK1059GSM
  194 Temperature_Celsius     0x0022   100   100   000    Old_age   Always       -       32 (Min/Max 20/46)
So we can get the information from every of the disks installed.
Now, let’s extend the SNMP daemon so that it prints disks temperature when polled:
  # vi /usr/syno/etc/snmpd.conf
  (...)
  #extend disktemp /opt/bin/bash -c "/opt/bin/find /dev/sd[a-z] -exec /usr/syno/bin/smartctl -iA -data {} \\; | /opt/bin/awk ' /Serial Number:/ { printf \"%s: \", \$NF }; /Temperature_Celsius/ { print \$10 }; ' | /opt/bin/sed -e \"s/[-_]//g\""
  # /usr/syno/etc/rc.d/S08snmpd.sh restart
From a remote machine, we can now get the results:
  # snmpget -v 2c -c public syno 'NET-SNMP-EXTEND-MIB::nsExtendResult."disktemp"'
  NET-SNMP-EXTEND-MIB::nsExtendResult."disktemp" = INTEGER: 0
  # snmpwalk -v 2c -c public syno 'NET-SNMP-EXTEND-MIB::nsExtendOutLine."disktemp"'
  NET-SNMP-EXTEND-MIB::nsExtendOutLine."disktemp".1 = STRING: Y0DHF8LPS: 31
  NET-SNMP-EXTEND-MIB::nsExtendOutLine."disktemp".2 = STRING: Y0DHF8KTS: 30
  NET-SNMP-EXTEND-MIB::nsExtendOutLine."disktemp".3 = STRING: 90L3P2GFT: 31
  NET-SNMP-EXTEND-MIB::nsExtendOutLine."disktemp".4 = STRING: WDWXN209NC0986: 35
That’s it! The information can now be grabbed, stored and graphed from you preferred monitoring tools.
What you see is what you get
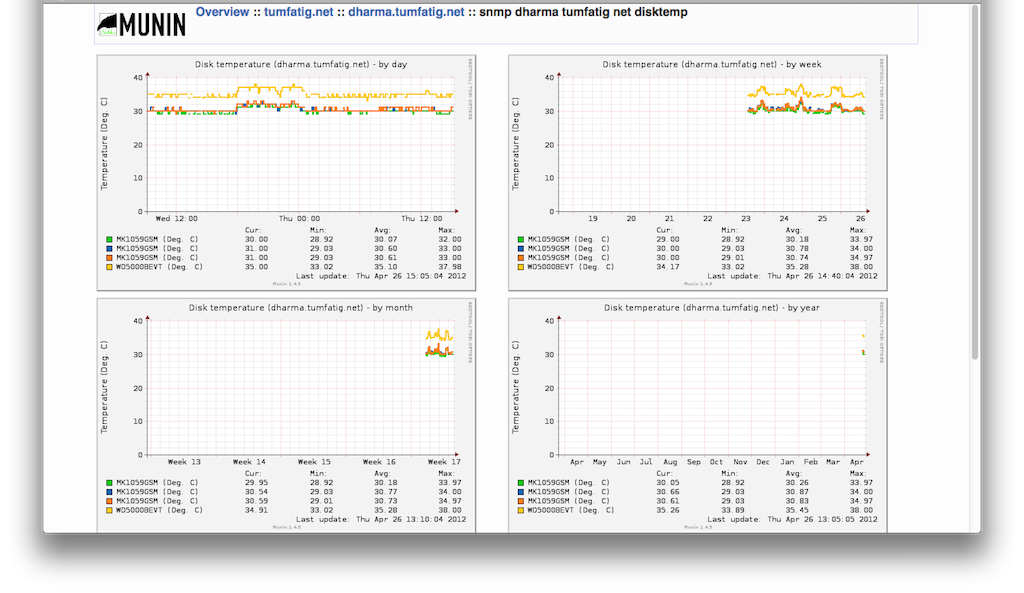
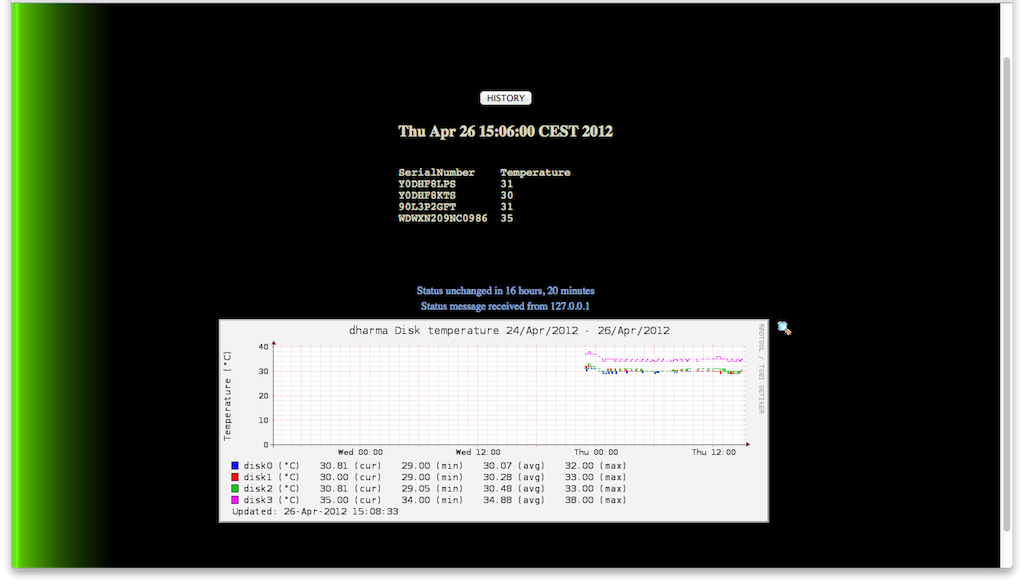
Here’re two examples of what I achieved using both “Munin” and “Xymon”. It only requires writing the scripts that will poll the snmp daemon and put the values into the correct format.
You can probably do the same with Nagios, Cacti, … but I don’t use those.
Improving response time
If you’ve had a detailed look at the graphs, you may have noticed that there are holes in the graphs. This is (AFAIK) because the snmpd of the syno answers in between 1.7 and 3 seconds. When it takes too long to answer, Munin and Xymon seem to not write the data in their RRDs.
Therefor, I have modified the way the data are published. From the synology:
  # touch /tmp/disktemp.log
  # cat /usr/syno/etc/snmpd.conf
  (...)
  extend disktemp /opt/bin/cat /tmp/disktemp.log
  # /usr/syno/etc/rc.d/S08snmpd.sh restart

  # cat /etc/crontab
  (...)
  */5	*	*	*	*	root	( /opt/bin/find /dev/sd[a-d] -exec /usr/syno/bin/smartctl -iA -d ata {} \; | /opt/bin/awk ' /Serial Number:/ { printf "%s: ", $NF }; /Temperature_Celsius/ { print $10 }; ' | /opt/bin/sed -e "s/[-_]//g" ) > /tmp/disktemp.log
  # /usr/syno/etc/rc.d/S04crond.sh stop
  stop crond
  # /usr/syno/etc/rc.d/S04crond.sh start
  Starting crond...
Here’s the time response comparison:
  snmpd only	snmpd and crontab
  real	0m2.387s	0m0.012s
  user	0m0.008s	0m0.008s
  sys	0m0.004s	0m0.004s
So far, I get no holes anymore. If the poll was to be done faster, one may change the crontab to generate the file oftener.
Source
Initial idea was stolen from there: Monitoring de la température des “disk” de Nexenta en SNMP
Unfortunately, my virtual Nexenta with Raw Device Mapping can get the SMART informations :-/

